Dutch West Indian vs Immigrants from South America Professional Degree
COMPARE
Dutch West Indian
Immigrants from South America
Professional Degree
Professional Degree Comparison
Dutch West Indians
Immigrants from South America
3.1%
PROFESSIONAL DEGREE
0.0/ 100
METRIC RATING
327th/ 347
METRIC RANK
4.6%
PROFESSIONAL DEGREE
80.5/ 100
METRIC RATING
144th/ 347
METRIC RANK
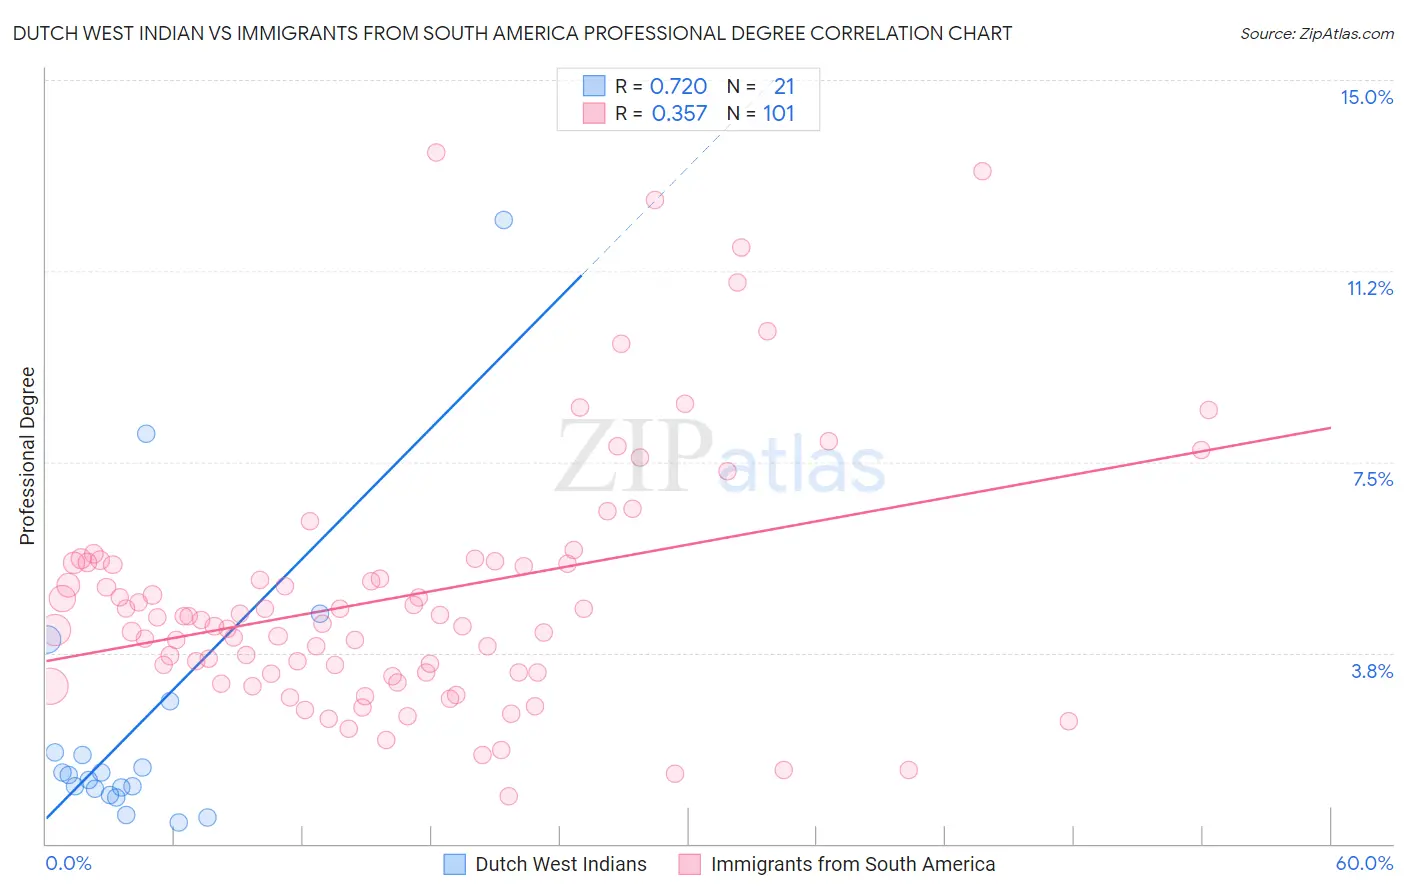
Dutch West Indian vs Immigrants from South America Professional Degree Correlation Chart
The statistical analysis conducted on geographies consisting of 85,349,686 people shows a strong positive correlation between the proportion of Dutch West Indians and percentage of population with at least professional degree education in the United States with a correlation coefficient (R) of 0.720 and weighted average of 3.1%. Similarly, the statistical analysis conducted on geographies consisting of 484,634,424 people shows a mild positive correlation between the proportion of Immigrants from South America and percentage of population with at least professional degree education in the United States with a correlation coefficient (R) of 0.357 and weighted average of 4.6%, a difference of 49.6%.
Professional Degree Correlation Summary
| Measurement | Dutch West Indian | Immigrants from South America |
| Minimum | 0.42% | 0.92% |
| Maximum | 12.2% | 13.6% |
| Range | 11.8% | 12.6% |
| Mean | 2.4% | 4.8% |
| Median | 1.4% | 4.4% |
| Interquartile 25% (IQ1) | 1.0% | 3.3% |
| Interquartile 75% (IQ3) | 2.3% | 5.5% |
| Interquartile Range (IQR) | 1.3% | 2.2% |
| Standard Deviation (Sample) | 2.9% | 2.5% |
| Standard Deviation (Population) | 2.8% | 2.5% |
Similar Demographics by Professional Degree
Demographics Similar to Dutch West Indians by Professional Degree
In terms of professional degree, the demographic groups most similar to Dutch West Indians are Creek (3.1%, a difference of 0.060%), Menominee (3.1%, a difference of 0.10%), Bangladeshi (3.1%, a difference of 0.27%), Immigrants from Cabo Verde (3.1%, a difference of 0.35%), and Kiowa (3.1%, a difference of 0.47%).
| Demographics | Rating | Rank | Professional Degree |
| Seminole | 0.1 /100 | #320 | Tragic 3.2% |
| Tsimshian | 0.0 /100 | #321 | Tragic 3.2% |
| Hispanics or Latinos | 0.0 /100 | #322 | Tragic 3.2% |
| Inupiat | 0.0 /100 | #323 | Tragic 3.2% |
| Crow | 0.0 /100 | #324 | Tragic 3.2% |
| Yaqui | 0.0 /100 | #325 | Tragic 3.2% |
| Menominee | 0.0 /100 | #326 | Tragic 3.1% |
| Dutch West Indians | 0.0 /100 | #327 | Tragic 3.1% |
| Creek | 0.0 /100 | #328 | Tragic 3.1% |
| Bangladeshis | 0.0 /100 | #329 | Tragic 3.1% |
| Immigrants | Cabo Verde | 0.0 /100 | #330 | Tragic 3.1% |
| Kiowa | 0.0 /100 | #331 | Tragic 3.1% |
| Yakama | 0.0 /100 | #332 | Tragic 3.1% |
| Puget Sound Salish | 0.0 /100 | #333 | Tragic 3.1% |
| Pennsylvania Germans | 0.0 /100 | #334 | Tragic 3.0% |
Demographics Similar to Immigrants from South America by Professional Degree
In terms of professional degree, the demographic groups most similar to Immigrants from South America are Uruguayan (4.6%, a difference of 0.060%), Hungarian (4.6%, a difference of 0.070%), Sudanese (4.6%, a difference of 0.18%), Basque (4.6%, a difference of 0.31%), and Luxembourger (4.6%, a difference of 0.37%).
| Demographics | Rating | Rank | Professional Degree |
| Jordanians | 88.9 /100 | #137 | Excellent 4.7% |
| Afghans | 88.8 /100 | #138 | Excellent 4.7% |
| South Americans | 85.6 /100 | #139 | Excellent 4.7% |
| Canadians | 84.4 /100 | #140 | Excellent 4.7% |
| Basques | 81.8 /100 | #141 | Excellent 4.6% |
| Sudanese | 81.3 /100 | #142 | Excellent 4.6% |
| Hungarians | 80.8 /100 | #143 | Excellent 4.6% |
| Immigrants | South America | 80.5 /100 | #144 | Excellent 4.6% |
| Uruguayans | 80.2 /100 | #145 | Excellent 4.6% |
| Luxembourgers | 78.7 /100 | #146 | Good 4.6% |
| Colombians | 77.7 /100 | #147 | Good 4.6% |
| Slovenes | 76.1 /100 | #148 | Good 4.6% |
| Senegalese | 75.3 /100 | #149 | Good 4.6% |
| Immigrants | Oceania | 73.4 /100 | #150 | Good 4.6% |
| Poles | 72.6 /100 | #151 | Good 4.6% |