Dutch vs Spanish Master's Degree
COMPARE
Dutch
Spanish
Master's Degree
Master's Degree Comparison
Dutch
Spanish
13.8%
MASTER'S DEGREE
8.7/ 100
METRIC RATING
230th/ 347
METRIC RANK
14.2%
MASTER'S DEGREE
17.8/ 100
METRIC RATING
212th/ 347
METRIC RANK
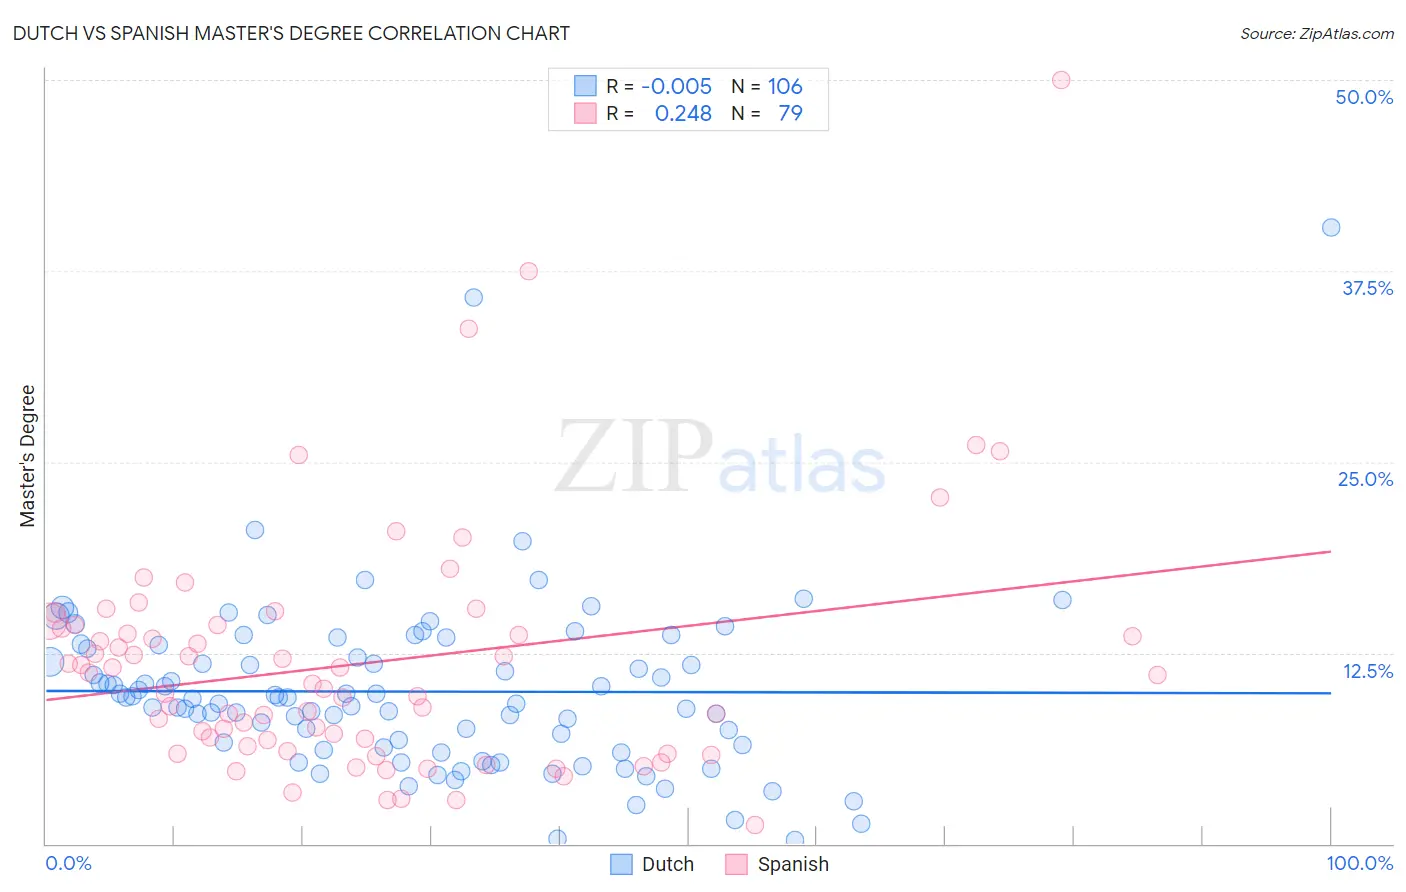
Dutch vs Spanish Master's Degree Correlation Chart
The statistical analysis conducted on geographies consisting of 553,710,662 people shows no correlation between the proportion of Dutch and percentage of population with at least master's degree education in the United States with a correlation coefficient (R) of -0.005 and weighted average of 13.8%. Similarly, the statistical analysis conducted on geographies consisting of 421,994,419 people shows a weak positive correlation between the proportion of Spanish and percentage of population with at least master's degree education in the United States with a correlation coefficient (R) of 0.248 and weighted average of 14.2%, a difference of 2.8%.
Master's Degree Correlation Summary
| Measurement | Dutch | Spanish |
| Minimum | 0.26% | 1.2% |
| Maximum | 40.4% | 50.0% |
| Range | 40.1% | 48.8% |
| Mean | 10.0% | 11.8% |
| Median | 9.5% | 10.5% |
| Interquartile 25% (IQ1) | 6.3% | 6.4% |
| Interquartile 75% (IQ3) | 12.8% | 14.3% |
| Interquartile Range (IQR) | 6.5% | 7.9% |
| Standard Deviation (Sample) | 5.7% | 8.0% |
| Standard Deviation (Population) | 5.7% | 7.9% |
Demographics Similar to Dutch and Spanish by Master's Degree
In terms of master's degree, the demographic groups most similar to Dutch are British West Indian (13.8%, a difference of 0.030%), White/Caucasian (13.8%, a difference of 0.14%), Immigrants from West Indies (13.9%, a difference of 0.45%), Guyanese (13.7%, a difference of 0.55%), and Immigrants from St. Vincent and the Grenadines (13.9%, a difference of 0.89%). Similarly, the demographic groups most similar to Spanish are Somali (14.2%, a difference of 0.050%), Immigrants from Thailand (14.2%, a difference of 0.19%), Finnish (14.2%, a difference of 0.20%), Immigrants from Vietnam (14.1%, a difference of 0.41%), and Immigrants from Somalia (14.1%, a difference of 0.47%).
| Demographics | Rating | Rank | Master's Degree |
| Somalis | 18.0 /100 | #211 | Poor 14.2% |
| Spanish | 17.8 /100 | #212 | Poor 14.2% |
| Immigrants | Thailand | 17.0 /100 | #213 | Poor 14.2% |
| Finns | 16.9 /100 | #214 | Poor 14.2% |
| Immigrants | Vietnam | 16.1 /100 | #215 | Poor 14.1% |
| Immigrants | Somalia | 15.8 /100 | #216 | Poor 14.1% |
| Immigrants | Trinidad and Tobago | 15.8 /100 | #217 | Poor 14.1% |
| French Canadians | 14.9 /100 | #218 | Poor 14.1% |
| Norwegians | 13.6 /100 | #219 | Poor 14.0% |
| Germans | 13.1 /100 | #220 | Poor 14.0% |
| Koreans | 12.7 /100 | #221 | Poor 14.0% |
| Ecuadorians | 12.6 /100 | #222 | Poor 14.0% |
| Immigrants | South Eastern Asia | 11.9 /100 | #223 | Poor 14.0% |
| Immigrants | Grenada | 11.8 /100 | #224 | Poor 14.0% |
| Portuguese | 11.2 /100 | #225 | Poor 13.9% |
| Immigrants | St. Vincent and the Grenadines | 11.0 /100 | #226 | Poor 13.9% |
| Immigrants | West Indies | 9.8 /100 | #227 | Tragic 13.9% |
| Whites/Caucasians | 9.1 /100 | #228 | Tragic 13.8% |
| British West Indians | 8.8 /100 | #229 | Tragic 13.8% |
| Dutch | 8.7 /100 | #230 | Tragic 13.8% |
| Guyanese | 7.6 /100 | #231 | Tragic 13.7% |