Dutch vs Immigrants from Cabo Verde 3rd Grade
COMPARE
Dutch
Immigrants from Cabo Verde
3rd Grade
3rd Grade Comparison
Dutch
Immigrants from Cabo Verde
98.5%
3RD GRADE
100.0/ 100
METRIC RATING
17th/ 347
METRIC RANK
96.2%
3RD GRADE
0.0/ 100
METRIC RATING
336th/ 347
METRIC RANK
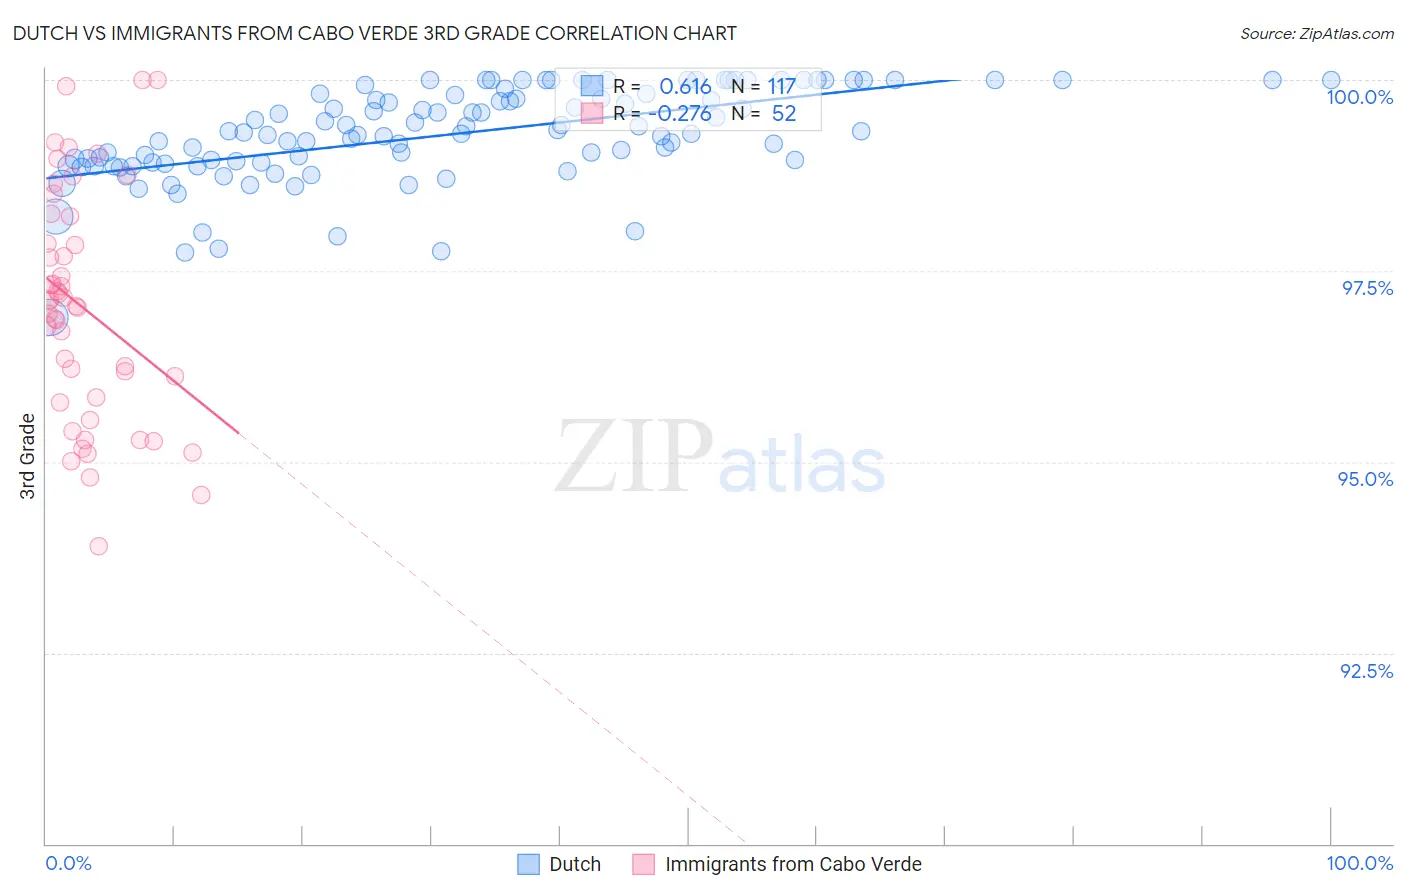
Dutch vs Immigrants from Cabo Verde 3rd Grade Correlation Chart
The statistical analysis conducted on geographies consisting of 554,359,260 people shows a significant positive correlation between the proportion of Dutch and percentage of population with at least 3rd grade education in the United States with a correlation coefficient (R) of 0.616 and weighted average of 98.5%. Similarly, the statistical analysis conducted on geographies consisting of 38,113,948 people shows a weak negative correlation between the proportion of Immigrants from Cabo Verde and percentage of population with at least 3rd grade education in the United States with a correlation coefficient (R) of -0.276 and weighted average of 96.2%, a difference of 2.4%.
3rd Grade Correlation Summary
| Measurement | Dutch | Immigrants from Cabo Verde |
| Minimum | 96.9% | 93.9% |
| Maximum | 100.0% | 100.0% |
| Range | 3.1% | 6.1% |
| Mean | 99.3% | 97.0% |
| Median | 99.3% | 97.1% |
| Interquartile 25% (IQ1) | 98.9% | 95.8% |
| Interquartile 75% (IQ3) | 99.8% | 98.0% |
| Interquartile Range (IQR) | 0.91% | 2.2% |
| Standard Deviation (Sample) | 0.61% | 1.5% |
| Standard Deviation (Population) | 0.61% | 1.5% |
Similar Demographics by 3rd Grade
Demographics Similar to Dutch by 3rd Grade
In terms of 3rd grade, the demographic groups most similar to Dutch are Scottish (98.5%, a difference of 0.010%), Irish (98.5%, a difference of 0.010%), Polish (98.5%, a difference of 0.020%), Pennsylvania German (98.5%, a difference of 0.020%), and Swedish (98.5%, a difference of 0.030%).
| Demographics | Rating | Rank | 3rd Grade |
| Alaska Natives | 100.0 /100 | #10 | Exceptional 98.6% |
| Slovenes | 100.0 /100 | #11 | Exceptional 98.6% |
| English | 100.0 /100 | #12 | Exceptional 98.6% |
| Tlingit-Haida | 100.0 /100 | #13 | Exceptional 98.5% |
| Carpatho Rusyns | 100.0 /100 | #14 | Exceptional 98.5% |
| Swedes | 100.0 /100 | #15 | Exceptional 98.5% |
| Scottish | 100.0 /100 | #16 | Exceptional 98.5% |
| Dutch | 100.0 /100 | #17 | Exceptional 98.5% |
| Irish | 100.0 /100 | #18 | Exceptional 98.5% |
| Poles | 100.0 /100 | #19 | Exceptional 98.5% |
| Pennsylvania Germans | 100.0 /100 | #20 | Exceptional 98.5% |
| Lithuanians | 100.0 /100 | #21 | Exceptional 98.5% |
| Finns | 100.0 /100 | #22 | Exceptional 98.5% |
| Sioux | 100.0 /100 | #23 | Exceptional 98.5% |
| Danes | 100.0 /100 | #24 | Exceptional 98.5% |
Demographics Similar to Immigrants from Cabo Verde by 3rd Grade
In terms of 3rd grade, the demographic groups most similar to Immigrants from Cabo Verde are Immigrants from Dominican Republic (96.2%, a difference of 0.010%), Immigrants from Cambodia (96.2%, a difference of 0.020%), Immigrants from Fiji (96.2%, a difference of 0.040%), Mexican (96.2%, a difference of 0.060%), and Immigrants from Latin America (96.2%, a difference of 0.080%).
| Demographics | Rating | Rank | 3rd Grade |
| Immigrants | Honduras | 0.0 /100 | #329 | Tragic 96.3% |
| Immigrants | Armenia | 0.0 /100 | #330 | Tragic 96.3% |
| Immigrants | Latin America | 0.0 /100 | #331 | Tragic 96.2% |
| Mexicans | 0.0 /100 | #332 | Tragic 96.2% |
| Immigrants | Fiji | 0.0 /100 | #333 | Tragic 96.2% |
| Immigrants | Cambodia | 0.0 /100 | #334 | Tragic 96.2% |
| Immigrants | Dominican Republic | 0.0 /100 | #335 | Tragic 96.2% |
| Immigrants | Cabo Verde | 0.0 /100 | #336 | Tragic 96.2% |
| Central Americans | 0.0 /100 | #337 | Tragic 96.1% |
| Guatemalans | 0.0 /100 | #338 | Tragic 96.0% |
| Yakama | 0.0 /100 | #339 | Tragic 95.9% |
| Nepalese | 0.0 /100 | #340 | Tragic 95.9% |
| Immigrants | Central America | 0.0 /100 | #341 | Tragic 95.8% |
| Immigrants | Guatemala | 0.0 /100 | #342 | Tragic 95.8% |
| Immigrants | Mexico | 0.0 /100 | #343 | Tragic 95.8% |