Dutch vs Apache High School Diploma

COMPARE

Dutch
Race
Ancestry
AfghanAfricanAlaska NativeAlaskan AthabascanAlbanianAleutAlsatianAmericanArabArapahoArgentineanArmenianAssyrian/Chaldean/SyriacAustralianAustrianBahamianBangladeshiBarbadianBasqueBelgianBelizeanBermudanBhutaneseBlackfeetBolivianBrazilianBritishBritish West IndianBulgarianBurmeseCajunCambodianCanadianCape VerdeanCarpatho RusynCelticCentral AmericanCentral American IndianCherokeeCheyenneChickasawChileanChineseChippewaChoctawColombianColvilleComancheCosta RicanCreeCreekCroatianCrowCubanCypriotCzechCzechoslovakianDanishDelawareDominicanDutchDutch West IndianEastern EuropeanEcuadorianEgyptianEnglishEstonianEthiopianEuropeanFijianFilipinoFinnishFrenchFrench American IndianFrench CanadianGermanGerman RussianGhanaianGreekGuamanian/ChamorroGuatemalanGuyaneseHaitianHmongHonduranHopiHoumaHungarianIcelanderIndian (Asian)IndonesianInupiatIranianIraqiIrishIroquoisIsraeliItalianJamaicanJapaneseJordanianKenyanKiowaKoreanLaotianLatvianLebaneseLiberianLithuanianLumbeeLuxembourgerMacedonianMalaysianMalteseMarshalleseMenomineeMexicanMexican American IndianMongolianMoroccanNative HawaiianNavajoNepaleseNew ZealanderNicaraguanNigerianNorthern EuropeanNorwegianOkinawanOsageOttawaPaiutePakistaniPalestinianPanamanianParaguayanPennsylvania GermanPeruvianPimaPolishPortuguesePotawatomiPuebloPuerto RicanPuget Sound SalishRomanianRussianSalvadoranSamoanScandinavianScotch-IrishScottishSeminoleSenegaleseSerbianShoshoneSierra LeoneanSiouxSlavicSlovakSloveneSomaliSouth AfricanSouth AmericanSouth American IndianSoviet UnionSpaniardSpanishSpanish AmericanSpanish American IndianSri LankanSubsaharan AfricanSudaneseSwedishSwissSyrianTaiwaneseThaiTlingit-HaidaTohono O'OdhamTonganTrinidadian and TobagonianTsimshianTurkishU.S. Virgin IslanderUgandanUkrainianUruguayanUteVenezuelanVietnameseWelshWest IndianYakamaYaquiYugoslavianYumanYup'ikZimbabwean
Immigration
NonimmigrantsImmigrantsAfghanistanAfricaAlbaniaArgentinaArmeniaAsiaAustraliaAustriaBahamasBangladeshBarbadosBelarusBelgiumBelizeBoliviaBosnia and HerzegovinaBrazilBulgariaBurma/MyanmarCabo VerdeCambodiaCameroonCanadaCaribbeanCentral AmericaChileChinaColombiaCongoCosta RicaCroatiaCubaCzechoslovakiaDenmarkDominicaDominican RepublicEastern AfricaEastern AsiaEastern EuropeEcuadorEgyptEl SalvadorEnglandEritreaEthiopiaEuropeFijiFranceGermanyGhanaGreeceGrenadaGuatemalaGuyanaHaitiHondurasHong KongHungaryIndiaIndonesiaIranIraqIrelandIsraelItalyJamaicaJapanJordanKazakhstanKenyaKoreaKuwaitLaosLatin AmericaLatviaLebanonLiberiaLithuaniaMalaysiaMexicoMicronesiaMiddle AfricaMoldovaMoroccoNepalNetherlandsNicaraguaNigeriaNorth AmericaNorth MacedoniaNorthern AfricaNorthern EuropeNorwayOceaniaPakistanPanamaPeruPhilippinesPolandPortugalRomaniaRussiaSaudi ArabiaScotlandSenegalSerbiaSierra LeoneSingaporeSomaliaSouth AfricaSouth AmericaSouth Central AsiaSouth Eastern AsiaSouthern EuropeSpainSri LankaSt. Vincent and the GrenadinesSudanSwedenSwitzerlandSyriaTaiwanThailandTrinidad and TobagoTurkeyUgandaUkraineUruguayUzbekistanVenezuelaVietnamWest IndiesWestern AfricaWestern AsiaWestern EuropeYemenZaireZimbabweAzores
Apache
Race
Ancestry
AfghanAfricanAlaska NativeAlaskan AthabascanAlbanianAleutAlsatianAmericanApacheArabArapahoArgentineanArmenianAssyrian/Chaldean/SyriacAustralianAustrianBahamianBangladeshiBarbadianBasqueBelgianBelizeanBermudanBhutaneseBlackfeetBolivianBrazilianBritishBritish West IndianBulgarianBurmeseCajunCambodianCanadianCape VerdeanCarpatho RusynCelticCentral AmericanCentral American IndianCherokeeCheyenneChickasawChileanChineseChippewaChoctawColombianColvilleComancheCosta RicanCreeCreekCroatianCrowCubanCypriotCzechCzechoslovakianDanishDelawareDominicanDutch West IndianEastern EuropeanEcuadorianEgyptianEnglishEstonianEthiopianEuropeanFijianFilipinoFinnishFrenchFrench American IndianFrench CanadianGermanGerman RussianGhanaianGreekGuamanian/ChamorroGuatemalanGuyaneseHaitianHmongHonduranHopiHoumaHungarianIcelanderIndian (Asian)IndonesianInupiatIranianIraqiIrishIroquoisIsraeliItalianJamaicanJapaneseJordanianKenyanKiowaKoreanLaotianLatvianLebaneseLiberianLithuanianLumbeeLuxembourgerMacedonianMalaysianMalteseMarshalleseMenomineeMexicanMexican American IndianMongolianMoroccanNative HawaiianNavajoNepaleseNew ZealanderNicaraguanNigerianNorthern EuropeanNorwegianOkinawanOsageOttawaPaiutePakistaniPalestinianPanamanianParaguayanPennsylvania GermanPeruvianPimaPolishPortuguesePotawatomiPuebloPuerto RicanPuget Sound SalishRomanianRussianSalvadoranSamoanScandinavianScotch-IrishScottishSeminoleSenegaleseSerbianShoshoneSierra LeoneanSiouxSlavicSlovakSloveneSomaliSouth AfricanSouth AmericanSouth American IndianSoviet UnionSpaniardSpanishSpanish AmericanSpanish American IndianSri LankanSubsaharan AfricanSudaneseSwedishSwissSyrianTaiwaneseThaiTlingit-HaidaTohono O'OdhamTonganTrinidadian and TobagonianTsimshianTurkishU.S. Virgin IslanderUgandanUkrainianUruguayanUteVenezuelanVietnameseWelshWest IndianYakamaYaquiYugoslavianYumanYup'ikZimbabwean
Immigration
NonimmigrantsImmigrantsAfghanistanAfricaAlbaniaArgentinaArmeniaAsiaAustraliaAustriaBahamasBangladeshBarbadosBelarusBelgiumBelizeBoliviaBosnia and HerzegovinaBrazilBulgariaBurma/MyanmarCabo VerdeCambodiaCameroonCanadaCaribbeanCentral AmericaChileChinaColombiaCongoCosta RicaCroatiaCubaCzechoslovakiaDenmarkDominicaDominican RepublicEastern AfricaEastern AsiaEastern EuropeEcuadorEgyptEl SalvadorEnglandEritreaEthiopiaEuropeFijiFranceGermanyGhanaGreeceGrenadaGuatemalaGuyanaHaitiHondurasHong KongHungaryIndiaIndonesiaIranIraqIrelandIsraelItalyJamaicaJapanJordanKazakhstanKenyaKoreaKuwaitLaosLatin AmericaLatviaLebanonLiberiaLithuaniaMalaysiaMexicoMicronesiaMiddle AfricaMoldovaMoroccoNepalNetherlandsNicaraguaNigeriaNorth AmericaNorth MacedoniaNorthern AfricaNorthern EuropeNorwayOceaniaPakistanPanamaPeruPhilippinesPolandPortugalRomaniaRussiaSaudi ArabiaScotlandSenegalSerbiaSierra LeoneSingaporeSomaliaSouth AfricaSouth AmericaSouth Central AsiaSouth Eastern AsiaSouthern EuropeSpainSri LankaSt. Vincent and the GrenadinesSudanSwedenSwitzerlandSyriaTaiwanThailandTrinidad and TobagoTurkeyUgandaUkraineUruguayUzbekistanVenezuelaVietnamWest IndiesWestern AfricaWestern AsiaWestern EuropeYemenZaireZimbabweAzores
High School Diploma
Income
Poverty
Unemployment
Labor Participation
Family Structure
Vehicle Availability
Education Level
Disability

High School Diploma Comparison

Dutch

Apache

Exceptional
Tragic
91.3%
HIGH SCHOOL DIPLOMA
99.8/ 100
METRIC RATING
39th/ 347
METRIC RANK
85.1%
HIGH SCHOOL DIPLOMA
0.0/ 100
METRIC RATING
310th/ 347
METRIC RANK

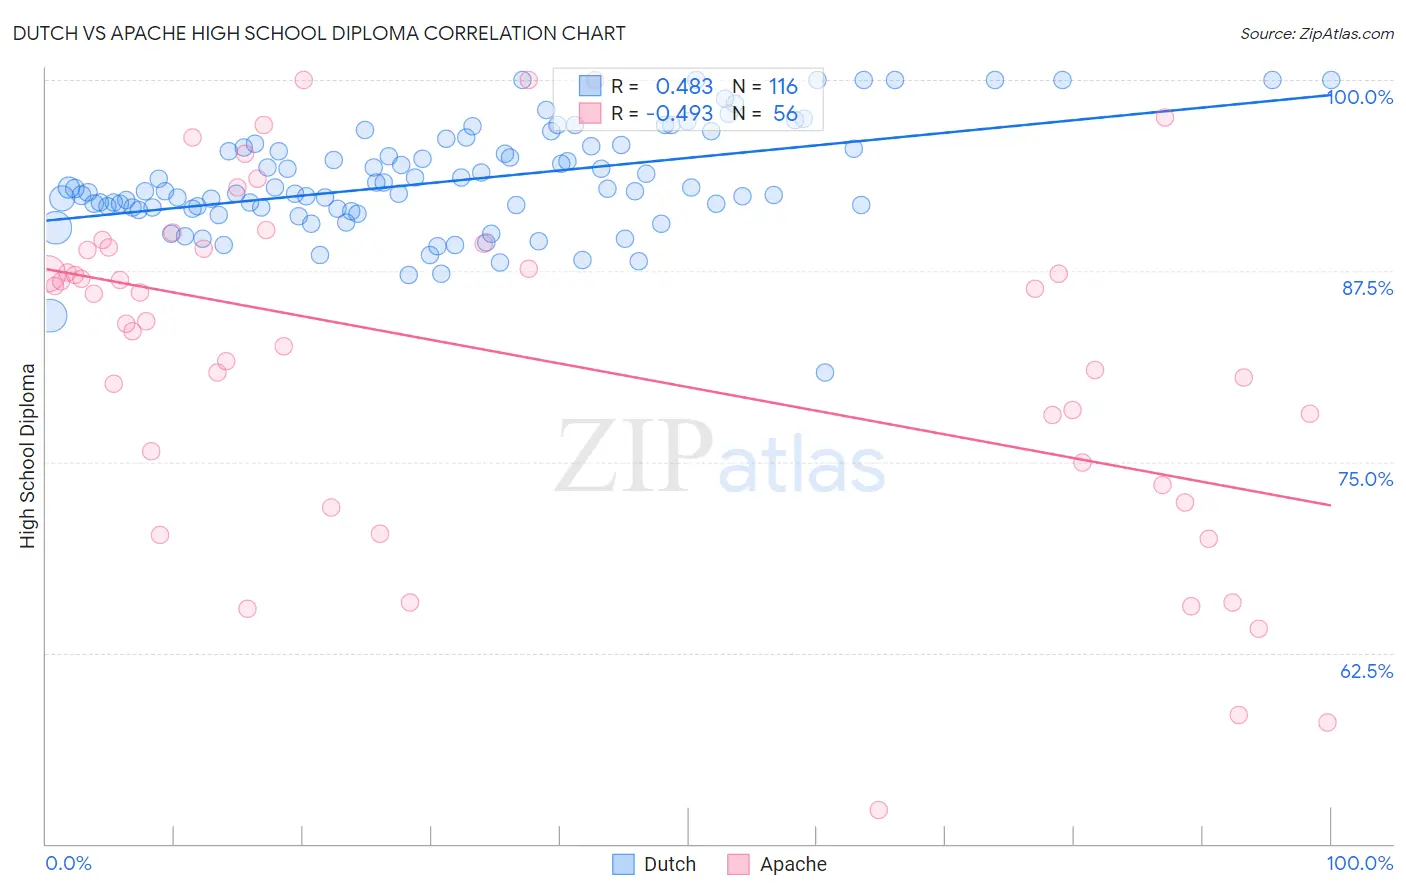
Dutch vs Apache High School Diploma Correlation Chart

The statistical analysis conducted on geographies consisting of 554,358,882 people shows a moderate positive correlation between the proportion of Dutch and percentage of population with at least high school diploma education in the United States with a correlation coefficient (R) of 0.483 and weighted average of 91.3%. Similarly, the statistical analysis conducted on geographies consisting of 231,143,094 people shows a moderate negative correlation between the proportion of Apache and percentage of population with at least high school diploma education in the United States with a correlation coefficient (R) of -0.493 and weighted average of 85.1%, a difference of 7.3%.
Dutch vs Apache High School Diploma

High School Diploma Correlation Summary

MeasurementDutchApache
Minimum80.9%52.2%
Maximum100.0%100.0%
Range19.1%47.8%
Mean93.3%81.9%
Median92.7%85.1%
Interquartile 25% (IQ1)91.6%74.2%
Interquartile 75% (IQ3)95.6%89.0%
Interquartile Range (IQR)4.1%14.8%
Standard Deviation (Sample)3.5%11.3%
Standard Deviation (Population)3.5%11.2%

Similar Demographics by High School Diploma

Demographics Similar to Dutch by High School Diploma

In terms of high school diploma, the demographic groups most similar to Dutch are Immigrants from Lithuania (91.3%, a difference of 0.0%), Immigrants from Scotland (91.3%, a difference of 0.020%), Immigrants from Australia (91.3%, a difference of 0.030%), Immigrants from Ireland (91.3%, a difference of 0.040%), and Northern European (91.3%, a difference of 0.040%).
DemographicsRating | RankHigh School Diploma
English
99.9
/100
|
#32
Exceptional
91.4%
Okinawans
99.9
/100
|
#33
Exceptional
91.4%
Scottish
99.9
/100
|
#34
Exceptional
91.4%
Irish
99.9
/100
|
#35
Exceptional
91.4%
Tsimshian
99.9
/100
|
#36
Exceptional
91.3%
Immigrants | Ireland
99.9
/100
|
#37
Exceptional
91.3%
Immigrants | Scotland
99.8
/100
|
#38
Exceptional
91.3%
Dutch
99.8
/100
|
#39
Exceptional
91.3%
Immigrants | Lithuania
99.8
/100
|
#40
Exceptional
91.3%
Immigrants | Australia
99.8
/100
|
#41
Exceptional
91.3%
Northern Europeans
99.8
/100
|
#42
Exceptional
91.3%
British
99.8
/100
|
#43
Exceptional
91.3%
Immigrants | Austria
99.8
/100
|
#44
Exceptional
91.3%
Turks
99.8
/100
|
#45
Exceptional
91.2%
Greeks
99.8
/100
|
#46
Exceptional
91.2%

Demographics Similar to Apache by High School Diploma

In terms of high school diploma, the demographic groups most similar to Apache are Ecuadorian (85.1%, a difference of 0.010%), Cape Verdean (85.1%, a difference of 0.060%), Immigrants from Dominica (85.2%, a difference of 0.080%), Immigrants from Armenia (85.2%, a difference of 0.090%), and Navajo (85.2%, a difference of 0.10%).
DemographicsRating | RankHigh School Diploma
Cubans
0.0
/100
|
#303
Tragic
85.4%
Nepalese
0.0
/100
|
#304
Tragic
85.3%
Immigrants | Portugal
0.0
/100
|
#305
Tragic
85.3%
Immigrants | Guyana
0.0
/100
|
#306
Tragic
85.3%
Navajo
0.0
/100
|
#307
Tragic
85.2%
Immigrants | Armenia
0.0
/100
|
#308
Tragic
85.2%
Immigrants | Dominica
0.0
/100
|
#309
Tragic
85.2%
Apache
0.0
/100
|
#310
Tragic
85.1%
Ecuadorians
0.0
/100
|
#311
Tragic
85.1%
Cape Verdeans
0.0
/100
|
#312
Tragic
85.1%
Immigrants | Ecuador
0.0
/100
|
#313
Tragic
84.8%
Yaqui
0.0
/100
|
#314
Tragic
84.7%
Puerto Ricans
0.0
/100
|
#315
Tragic
84.7%
Belizeans
0.0
/100
|
#316
Tragic
84.3%
Immigrants | Caribbean
0.0
/100
|
#317
Tragic
84.3%