Dominican vs Immigrants from Latvia 3rd Grade
COMPARE
Dominican
Immigrants from Latvia
3rd Grade
3rd Grade Comparison
Dominicans
Immigrants from Latvia
96.4%
3RD GRADE
0.0/ 100
METRIC RATING
324th/ 347
METRIC RANK
98.0%
3RD GRADE
96.0/ 100
METRIC RATING
112th/ 347
METRIC RANK
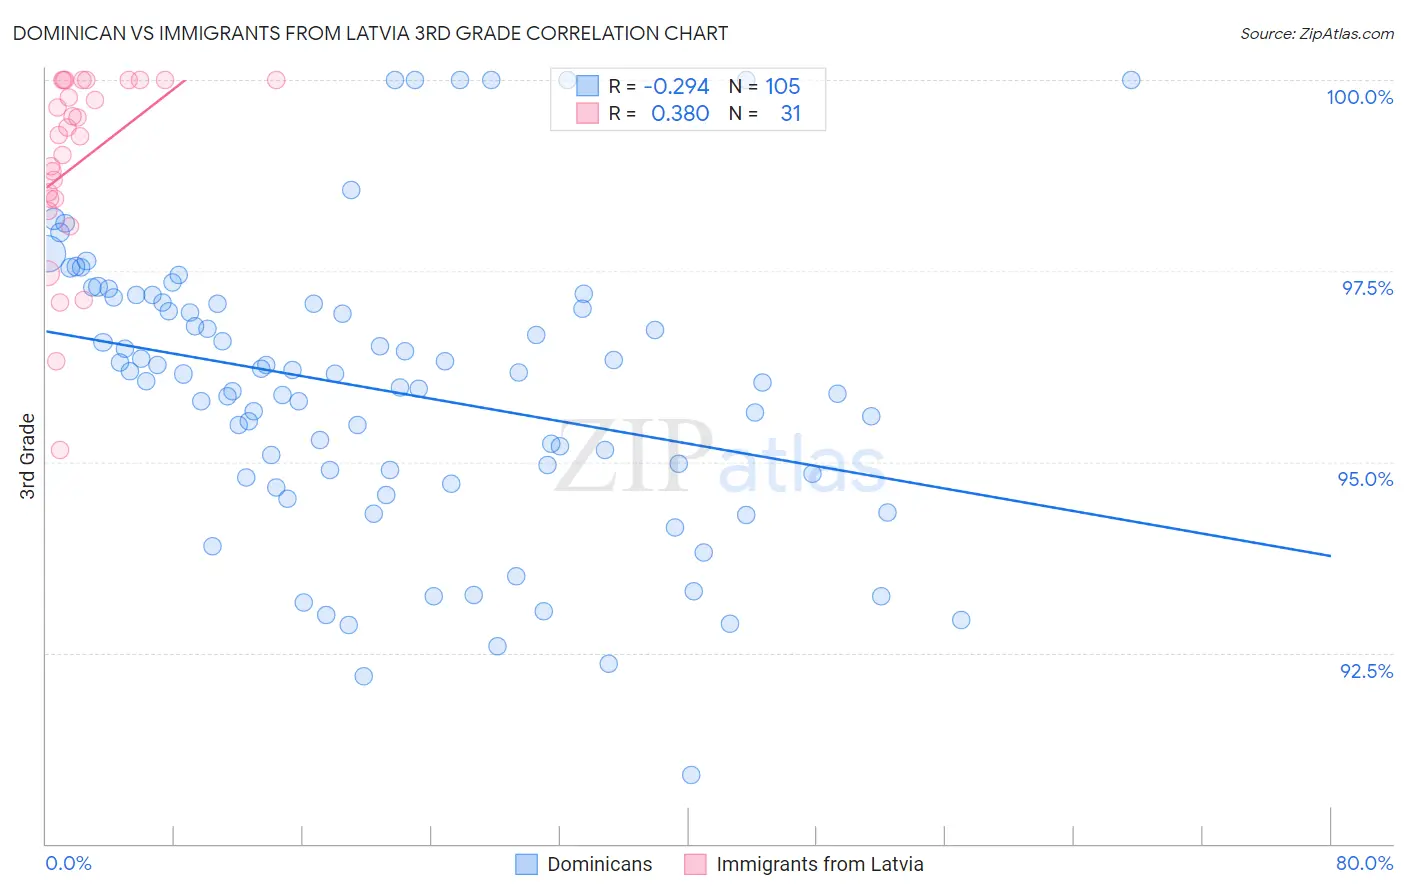
Dominican vs Immigrants from Latvia 3rd Grade Correlation Chart
The statistical analysis conducted on geographies consisting of 355,142,603 people shows a weak negative correlation between the proportion of Dominicans and percentage of population with at least 3rd grade education in the United States with a correlation coefficient (R) of -0.294 and weighted average of 96.4%. Similarly, the statistical analysis conducted on geographies consisting of 113,735,345 people shows a mild positive correlation between the proportion of Immigrants from Latvia and percentage of population with at least 3rd grade education in the United States with a correlation coefficient (R) of 0.380 and weighted average of 98.0%, a difference of 1.7%.
3rd Grade Correlation Summary
| Measurement | Dominican | Immigrants from Latvia |
| Minimum | 90.9% | 95.2% |
| Maximum | 100.0% | 100.0% |
| Range | 9.1% | 4.8% |
| Mean | 95.9% | 98.9% |
| Median | 96.1% | 99.3% |
| Interquartile 25% (IQ1) | 94.8% | 98.4% |
| Interquartile 75% (IQ3) | 97.1% | 100.0% |
| Interquartile Range (IQR) | 2.3% | 1.6% |
| Standard Deviation (Sample) | 1.9% | 1.2% |
| Standard Deviation (Population) | 1.9% | 1.2% |
Similar Demographics by 3rd Grade
Demographics Similar to Dominicans by 3rd Grade
In terms of 3rd grade, the demographic groups most similar to Dominicans are Mexican American Indian (96.4%, a difference of 0.010%), Immigrants from Vietnam (96.4%, a difference of 0.050%), Japanese (96.4%, a difference of 0.060%), Bangladeshi (96.3%, a difference of 0.060%), and Honduran (96.5%, a difference of 0.080%).
| Demographics | Rating | Rank | 3rd Grade |
| Immigrants | Bangladesh | 0.0 /100 | #317 | Tragic 96.6% |
| Hispanics or Latinos | 0.0 /100 | #318 | Tragic 96.5% |
| Vietnamese | 0.0 /100 | #319 | Tragic 96.5% |
| Immigrants | Nicaragua | 0.0 /100 | #320 | Tragic 96.5% |
| Indonesians | 0.0 /100 | #321 | Tragic 96.5% |
| Immigrants | Belize | 0.0 /100 | #322 | Tragic 96.5% |
| Hondurans | 0.0 /100 | #323 | Tragic 96.5% |
| Dominicans | 0.0 /100 | #324 | Tragic 96.4% |
| Mexican American Indians | 0.0 /100 | #325 | Tragic 96.4% |
| Immigrants | Vietnam | 0.0 /100 | #326 | Tragic 96.4% |
| Japanese | 0.0 /100 | #327 | Tragic 96.4% |
| Bangladeshis | 0.0 /100 | #328 | Tragic 96.3% |
| Immigrants | Honduras | 0.0 /100 | #329 | Tragic 96.3% |
| Immigrants | Armenia | 0.0 /100 | #330 | Tragic 96.3% |
| Immigrants | Latin America | 0.0 /100 | #331 | Tragic 96.2% |
Demographics Similar to Immigrants from Latvia by 3rd Grade
In terms of 3rd grade, the demographic groups most similar to Immigrants from Latvia are Basque (98.0%, a difference of 0.010%), Thai (98.0%, a difference of 0.010%), Menominee (98.0%, a difference of 0.010%), Immigrants from Czechoslovakia (98.0%, a difference of 0.020%), and Immigrants from Singapore (98.0%, a difference of 0.020%).
| Demographics | Rating | Rank | 3rd Grade |
| German Russians | 97.2 /100 | #105 | Exceptional 98.1% |
| Bhutanese | 97.2 /100 | #106 | Exceptional 98.1% |
| Immigrants | Czechoslovakia | 97.0 /100 | #107 | Exceptional 98.0% |
| Immigrants | Singapore | 96.7 /100 | #108 | Exceptional 98.0% |
| Pima | 96.7 /100 | #109 | Exceptional 98.0% |
| Immigrants | Switzerland | 96.6 /100 | #110 | Exceptional 98.0% |
| Basques | 96.5 /100 | #111 | Exceptional 98.0% |
| Immigrants | Latvia | 96.0 /100 | #112 | Exceptional 98.0% |
| Thais | 95.5 /100 | #113 | Exceptional 98.0% |
| Menominee | 95.4 /100 | #114 | Exceptional 98.0% |
| Okinawans | 95.2 /100 | #115 | Exceptional 98.0% |
| Immigrants | Norway | 95.2 /100 | #116 | Exceptional 98.0% |
| Immigrants | France | 95.1 /100 | #117 | Exceptional 98.0% |
| Iranians | 94.9 /100 | #118 | Exceptional 98.0% |
| Spanish | 94.8 /100 | #119 | Exceptional 98.0% |