Dominican vs Immigrants from Australia 2nd Grade
COMPARE
Dominican
Immigrants from Australia
2nd Grade
2nd Grade Comparison
Dominicans
Immigrants from Australia
96.6%
2ND GRADE
0.0/ 100
METRIC RATING
325th/ 347
METRIC RANK
98.2%
2ND GRADE
99.0/ 100
METRIC RATING
86th/ 347
METRIC RANK
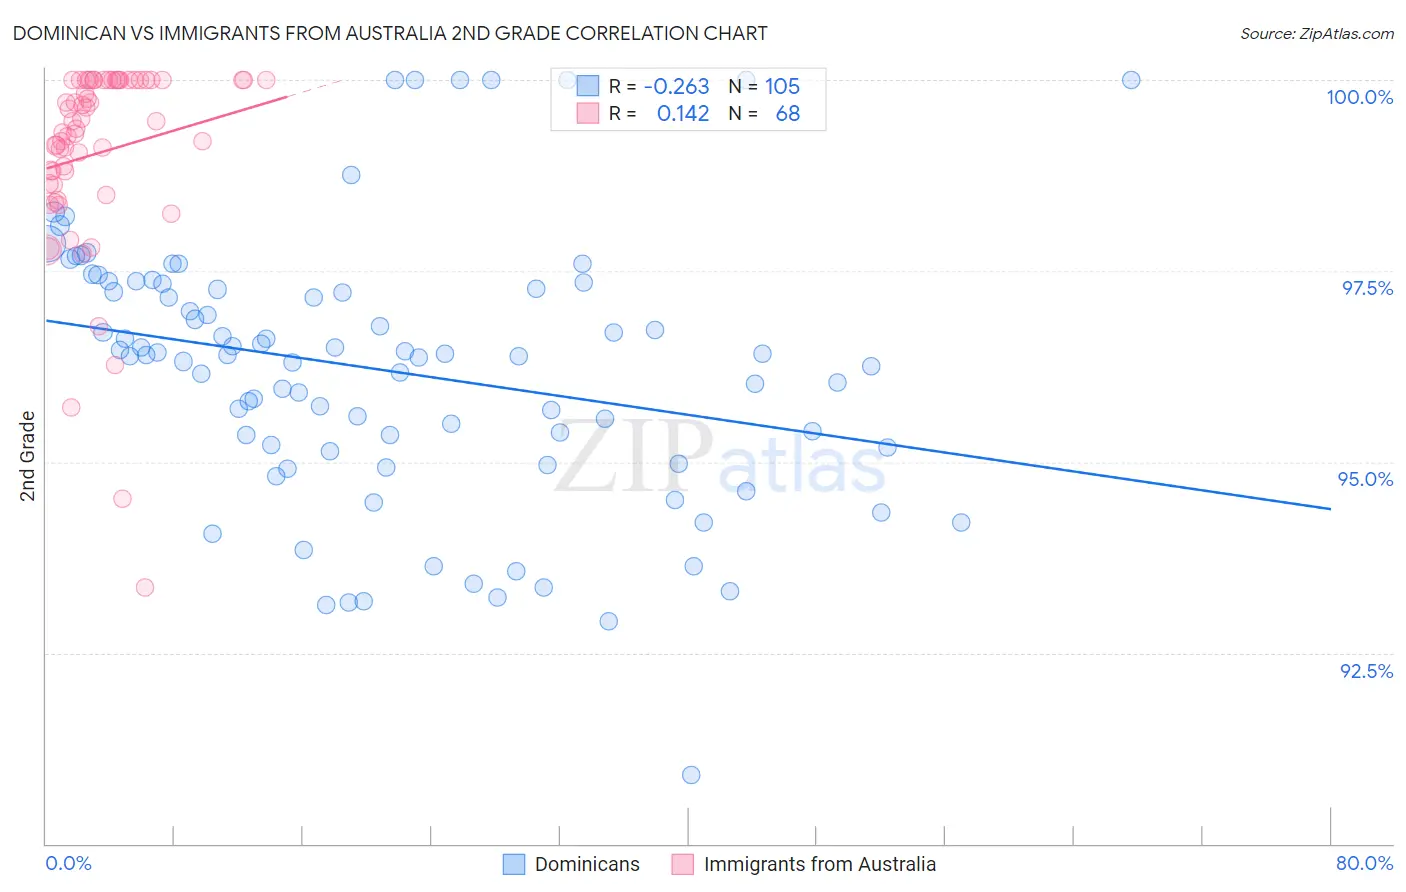
Dominican vs Immigrants from Australia 2nd Grade Correlation Chart
The statistical analysis conducted on geographies consisting of 355,142,603 people shows a weak negative correlation between the proportion of Dominicans and percentage of population with at least 2nd grade education in the United States with a correlation coefficient (R) of -0.263 and weighted average of 96.6%. Similarly, the statistical analysis conducted on geographies consisting of 227,203,469 people shows a poor positive correlation between the proportion of Immigrants from Australia and percentage of population with at least 2nd grade education in the United States with a correlation coefficient (R) of 0.142 and weighted average of 98.2%, a difference of 1.7%.
2nd Grade Correlation Summary
| Measurement | Dominican | Immigrants from Australia |
| Minimum | 90.9% | 93.4% |
| Maximum | 100.0% | 100.0% |
| Range | 9.1% | 6.6% |
| Mean | 96.2% | 99.0% |
| Median | 96.4% | 99.4% |
| Interquartile 25% (IQ1) | 95.2% | 98.6% |
| Interquartile 75% (IQ3) | 97.3% | 100.0% |
| Interquartile Range (IQR) | 2.1% | 1.4% |
| Standard Deviation (Sample) | 1.8% | 1.3% |
| Standard Deviation (Population) | 1.8% | 1.3% |
Similar Demographics by 2nd Grade
Demographics Similar to Dominicans by 2nd Grade
In terms of 2nd grade, the demographic groups most similar to Dominicans are Immigrants from Honduras (96.6%, a difference of 0.0%), Mexican American Indian (96.7%, a difference of 0.040%), Vietnamese (96.7%, a difference of 0.060%), Immigrants from Bangladesh (96.7%, a difference of 0.090%), and Immigrants from Vietnam (96.5%, a difference of 0.090%).
| Demographics | Rating | Rank | 2nd Grade |
| Indonesians | 0.0 /100 | #318 | Tragic 96.7% |
| Immigrants | Nicaragua | 0.0 /100 | #319 | Tragic 96.7% |
| Immigrants | Guyana | 0.0 /100 | #320 | Tragic 96.7% |
| Immigrants | Burma/Myanmar | 0.0 /100 | #321 | Tragic 96.7% |
| Immigrants | Bangladesh | 0.0 /100 | #322 | Tragic 96.7% |
| Vietnamese | 0.0 /100 | #323 | Tragic 96.7% |
| Mexican American Indians | 0.0 /100 | #324 | Tragic 96.7% |
| Dominicans | 0.0 /100 | #325 | Tragic 96.6% |
| Immigrants | Honduras | 0.0 /100 | #326 | Tragic 96.6% |
| Immigrants | Vietnam | 0.0 /100 | #327 | Tragic 96.5% |
| Mexicans | 0.0 /100 | #328 | Tragic 96.5% |
| Japanese | 0.0 /100 | #329 | Tragic 96.5% |
| Immigrants | Latin America | 0.0 /100 | #330 | Tragic 96.5% |
| Immigrants | Armenia | 0.0 /100 | #331 | Tragic 96.5% |
| Bangladeshis | 0.0 /100 | #332 | Tragic 96.5% |
Demographics Similar to Immigrants from Australia by 2nd Grade
In terms of 2nd grade, the demographic groups most similar to Immigrants from Australia are Potawatomi (98.2%, a difference of 0.0%), Immigrants from Denmark (98.2%, a difference of 0.0%), Macedonian (98.2%, a difference of 0.0%), Icelander (98.2%, a difference of 0.010%), and Delaware (98.2%, a difference of 0.010%).
| Demographics | Rating | Rank | 2nd Grade |
| Immigrants | Belgium | 99.3 /100 | #79 | Exceptional 98.2% |
| Osage | 99.2 /100 | #80 | Exceptional 98.2% |
| Icelanders | 99.2 /100 | #81 | Exceptional 98.2% |
| Delaware | 99.1 /100 | #82 | Exceptional 98.2% |
| Immigrants | Sweden | 99.1 /100 | #83 | Exceptional 98.2% |
| Hopi | 99.1 /100 | #84 | Exceptional 98.2% |
| Potawatomi | 99.1 /100 | #85 | Exceptional 98.2% |
| Immigrants | Australia | 99.0 /100 | #86 | Exceptional 98.2% |
| Immigrants | Denmark | 99.0 /100 | #87 | Exceptional 98.2% |
| Macedonians | 99.0 /100 | #88 | Exceptional 98.2% |
| Ukrainians | 98.9 /100 | #89 | Exceptional 98.2% |
| Zimbabweans | 98.8 /100 | #90 | Exceptional 98.2% |
| Immigrants | Western Europe | 98.8 /100 | #91 | Exceptional 98.2% |
| Immigrants | South Africa | 98.8 /100 | #92 | Exceptional 98.2% |
| Immigrants | India | 98.8 /100 | #93 | Exceptional 98.2% |