Dominican vs Immigrants from Albania 11th Grade
COMPARE
Dominican
Immigrants from Albania
11th Grade
11th Grade Comparison
Dominicans
Immigrants from Albania
87.7%
11TH GRADE
0.0/ 100
METRIC RATING
326th/ 347
METRIC RANK
92.6%
11TH GRADE
57.8/ 100
METRIC RATING
169th/ 347
METRIC RANK
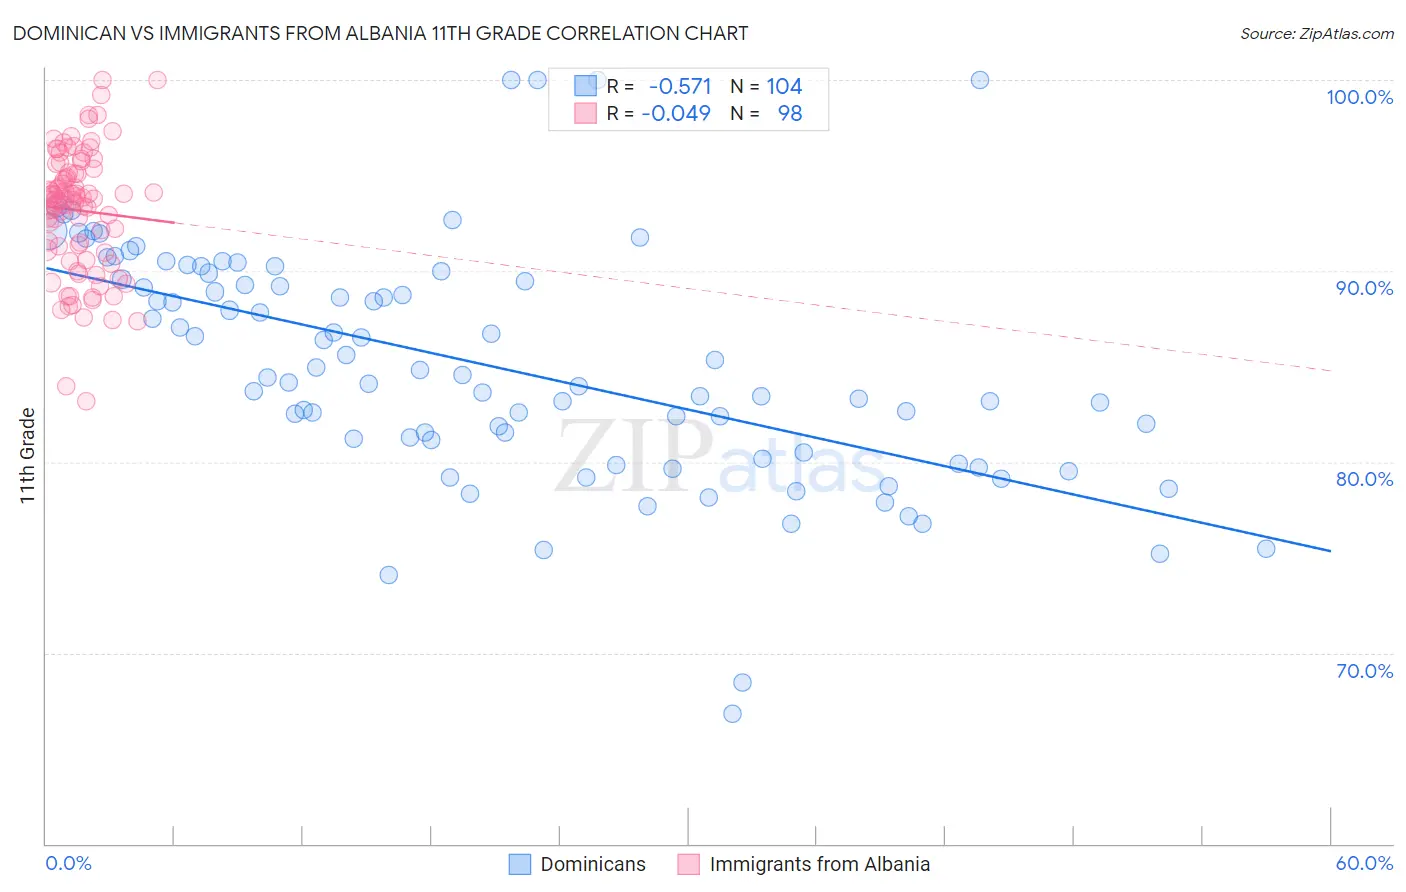
Dominican vs Immigrants from Albania 11th Grade Correlation Chart
The statistical analysis conducted on geographies consisting of 355,142,452 people shows a substantial negative correlation between the proportion of Dominicans and percentage of population with at least 11th grade education in the United States with a correlation coefficient (R) of -0.571 and weighted average of 87.7%. Similarly, the statistical analysis conducted on geographies consisting of 119,309,649 people shows no correlation between the proportion of Immigrants from Albania and percentage of population with at least 11th grade education in the United States with a correlation coefficient (R) of -0.049 and weighted average of 92.6%, a difference of 5.6%.
11th Grade Correlation Summary
| Measurement | Dominican | Immigrants from Albania |
| Minimum | 66.8% | 83.2% |
| Maximum | 100.0% | 100.0% |
| Range | 33.2% | 16.8% |
| Mean | 85.1% | 93.2% |
| Median | 84.5% | 93.8% |
| Interquartile 25% (IQ1) | 80.8% | 91.1% |
| Interquartile 75% (IQ3) | 89.7% | 95.2% |
| Interquartile Range (IQR) | 8.9% | 4.1% |
| Standard Deviation (Sample) | 6.2% | 3.3% |
| Standard Deviation (Population) | 6.2% | 3.2% |
Similar Demographics by 11th Grade
Demographics Similar to Dominicans by 11th Grade
In terms of 11th grade, the demographic groups most similar to Dominicans are Immigrants from Cabo Verde (87.6%, a difference of 0.020%), Tohono O'odham (87.6%, a difference of 0.080%), Mexican American Indian (87.5%, a difference of 0.15%), Honduran (87.4%, a difference of 0.34%), and Hispanic or Latino (87.3%, a difference of 0.40%).
| Demographics | Rating | Rank | 11th Grade |
| Belizeans | 0.0 /100 | #319 | Tragic 88.8% |
| Immigrants | Armenia | 0.0 /100 | #320 | Tragic 88.8% |
| Immigrants | Belize | 0.0 /100 | #321 | Tragic 88.7% |
| Puerto Ricans | 0.0 /100 | #322 | Tragic 88.4% |
| Pima | 0.0 /100 | #323 | Tragic 88.3% |
| Central American Indians | 0.0 /100 | #324 | Tragic 88.2% |
| Immigrants | Nicaragua | 0.0 /100 | #325 | Tragic 88.1% |
| Dominicans | 0.0 /100 | #326 | Tragic 87.7% |
| Immigrants | Cabo Verde | 0.0 /100 | #327 | Tragic 87.6% |
| Tohono O'odham | 0.0 /100 | #328 | Tragic 87.6% |
| Mexican American Indians | 0.0 /100 | #329 | Tragic 87.5% |
| Hondurans | 0.0 /100 | #330 | Tragic 87.4% |
| Hispanics or Latinos | 0.0 /100 | #331 | Tragic 87.3% |
| Immigrants | Azores | 0.0 /100 | #332 | Tragic 87.2% |
| Immigrants | Yemen | 0.0 /100 | #333 | Tragic 87.1% |
Demographics Similar to Immigrants from Albania by 11th Grade
In terms of 11th grade, the demographic groups most similar to Immigrants from Albania are Immigrants from Northern Africa (92.6%, a difference of 0.0%), Sierra Leonean (92.6%, a difference of 0.010%), Alsatian (92.6%, a difference of 0.020%), Laotian (92.6%, a difference of 0.030%), and Bermudan (92.6%, a difference of 0.050%).
| Demographics | Rating | Rank | 11th Grade |
| Paraguayans | 68.7 /100 | #162 | Good 92.7% |
| Immigrants | Nonimmigrants | 66.6 /100 | #163 | Good 92.7% |
| Spanish | 66.2 /100 | #164 | Good 92.7% |
| Immigrants | Iraq | 63.7 /100 | #165 | Good 92.6% |
| Bermudans | 62.3 /100 | #166 | Good 92.6% |
| Alsatians | 60.2 /100 | #167 | Good 92.6% |
| Sierra Leoneans | 58.7 /100 | #168 | Average 92.6% |
| Immigrants | Albania | 57.8 /100 | #169 | Average 92.6% |
| Immigrants | Northern Africa | 57.3 /100 | #170 | Average 92.6% |
| Laotians | 54.4 /100 | #171 | Average 92.6% |
| Immigrants | Pakistan | 52.3 /100 | #172 | Average 92.5% |
| Indians (Asian) | 51.5 /100 | #173 | Average 92.5% |
| Asians | 50.0 /100 | #174 | Average 92.5% |
| Shoshone | 48.9 /100 | #175 | Average 92.5% |
| Spaniards | 46.9 /100 | #176 | Average 92.5% |