Danish vs Swiss College, Under 1 year

COMPARE

Danish
Race
Ancestry
AfghanAfricanAlaska NativeAlaskan AthabascanAlbanianAleutAlsatianAmericanApacheArabArapahoArgentineanArmenianAssyrian/Chaldean/SyriacAustralianAustrianBahamianBangladeshiBarbadianBasqueBelgianBelizeanBermudanBhutaneseBlackfeetBolivianBrazilianBritishBritish West IndianBulgarianBurmeseCajunCambodianCanadianCape VerdeanCarpatho RusynCelticCentral AmericanCentral American IndianCherokeeCheyenneChickasawChileanChineseChippewaChoctawColombianColvilleComancheCosta RicanCreeCreekCroatianCrowCubanCypriotCzechCzechoslovakianDanishDelawareDominicanDutchDutch West IndianEastern EuropeanEcuadorianEgyptianEnglishEstonianEthiopianEuropeanFijianFilipinoFinnishFrenchFrench American IndianFrench CanadianGermanGerman RussianGhanaianGreekGuamanian/ChamorroGuatemalanGuyaneseHaitianHmongHonduranHopiHoumaHungarianIcelanderIndian (Asian)IndonesianInupiatIranianIraqiIrishIroquoisIsraeliItalianJamaicanJapaneseJordanianKenyanKiowaKoreanLaotianLatvianLebaneseLiberianLithuanianLumbeeLuxembourgerMacedonianMalaysianMalteseMarshalleseMenomineeMexicanMexican American IndianMongolianMoroccanNative HawaiianNavajoNepaleseNew ZealanderNicaraguanNigerianNorthern EuropeanNorwegianOkinawanOsageOttawaPaiutePakistaniPalestinianPanamanianParaguayanPennsylvania GermanPeruvianPimaPolishPortuguesePotawatomiPuebloPuerto RicanPuget Sound SalishRomanianRussianSalvadoranSamoanScandinavianScotch-IrishScottishSeminoleSenegaleseSerbianShoshoneSierra LeoneanSiouxSlavicSlovakSloveneSomaliSouth AfricanSouth AmericanSouth American IndianSoviet UnionSpaniardSpanishSpanish AmericanSpanish American IndianSri LankanSubsaharan AfricanSudaneseSwedishSyrianTaiwaneseThaiTlingit-HaidaTohono O'OdhamTonganTrinidadian and TobagonianTsimshianTurkishU.S. Virgin IslanderUgandanUkrainianUruguayanUteVenezuelanVietnameseWelshWest IndianYakamaYaquiYugoslavianYumanYup'ikZimbabwean
Immigration
NonimmigrantsImmigrantsAfghanistanAfricaAlbaniaArgentinaArmeniaAsiaAustraliaAustriaBahamasBangladeshBarbadosBelarusBelgiumBelizeBoliviaBosnia and HerzegovinaBrazilBulgariaBurma/MyanmarCabo VerdeCambodiaCameroonCanadaCaribbeanCentral AmericaChileChinaColombiaCongoCosta RicaCroatiaCubaCzechoslovakiaDenmarkDominicaDominican RepublicEastern AfricaEastern AsiaEastern EuropeEcuadorEgyptEl SalvadorEnglandEritreaEthiopiaEuropeFijiFranceGermanyGhanaGreeceGrenadaGuatemalaGuyanaHaitiHondurasHong KongHungaryIndiaIndonesiaIranIraqIrelandIsraelItalyJamaicaJapanJordanKazakhstanKenyaKoreaKuwaitLaosLatin AmericaLatviaLebanonLiberiaLithuaniaMalaysiaMexicoMicronesiaMiddle AfricaMoldovaMoroccoNepalNetherlandsNicaraguaNigeriaNorth AmericaNorth MacedoniaNorthern AfricaNorthern EuropeNorwayOceaniaPakistanPanamaPeruPhilippinesPolandPortugalRomaniaRussiaSaudi ArabiaScotlandSenegalSerbiaSierra LeoneSingaporeSomaliaSouth AfricaSouth AmericaSouth Central AsiaSouth Eastern AsiaSouthern EuropeSpainSri LankaSt. Vincent and the GrenadinesSudanSwedenSwitzerlandSyriaTaiwanThailandTrinidad and TobagoTurkeyUgandaUkraineUruguayUzbekistanVenezuelaVietnamWest IndiesWestern AfricaWestern AsiaWestern EuropeYemenZaireZimbabweAzores
Swiss
Race
Ancestry
AfghanAfricanAlaska NativeAlaskan AthabascanAlbanianAleutAlsatianAmericanApacheArabArapahoArgentineanArmenianAssyrian/Chaldean/SyriacAustralianAustrianBahamianBangladeshiBarbadianBasqueBelgianBelizeanBermudanBhutaneseBlackfeetBolivianBrazilianBritishBritish West IndianBulgarianBurmeseCajunCambodianCanadianCape VerdeanCarpatho RusynCelticCentral AmericanCentral American IndianCherokeeCheyenneChickasawChileanChineseChippewaChoctawColombianColvilleComancheCosta RicanCreeCreekCroatianCrowCubanCypriotCzechCzechoslovakianDelawareDominicanDutchDutch West IndianEastern EuropeanEcuadorianEgyptianEnglishEstonianEthiopianEuropeanFijianFilipinoFinnishFrenchFrench American IndianFrench CanadianGermanGerman RussianGhanaianGreekGuamanian/ChamorroGuatemalanGuyaneseHaitianHmongHonduranHopiHoumaHungarianIcelanderIndian (Asian)IndonesianInupiatIranianIraqiIrishIroquoisIsraeliItalianJamaicanJapaneseJordanianKenyanKiowaKoreanLaotianLatvianLebaneseLiberianLithuanianLumbeeLuxembourgerMacedonianMalaysianMalteseMarshalleseMenomineeMexicanMexican American IndianMongolianMoroccanNative HawaiianNavajoNepaleseNew ZealanderNicaraguanNigerianNorthern EuropeanNorwegianOkinawanOsageOttawaPaiutePakistaniPalestinianPanamanianParaguayanPennsylvania GermanPeruvianPimaPolishPortuguesePotawatomiPuebloPuerto RicanPuget Sound SalishRomanianRussianSalvadoranSamoanScandinavianScotch-IrishScottishSeminoleSenegaleseSerbianShoshoneSierra LeoneanSiouxSlavicSlovakSloveneSomaliSouth AfricanSouth AmericanSouth American IndianSoviet UnionSpaniardSpanishSpanish AmericanSpanish American IndianSri LankanSubsaharan AfricanSudaneseSwedishSwissSyrianTaiwaneseThaiTlingit-HaidaTohono O'OdhamTonganTrinidadian and TobagonianTsimshianTurkishU.S. Virgin IslanderUgandanUkrainianUruguayanUteVenezuelanVietnameseWelshWest IndianYakamaYaquiYugoslavianYumanYup'ikZimbabwean
Immigration
NonimmigrantsImmigrantsAfghanistanAfricaAlbaniaArgentinaArmeniaAsiaAustraliaAustriaBahamasBangladeshBarbadosBelarusBelgiumBelizeBoliviaBosnia and HerzegovinaBrazilBulgariaBurma/MyanmarCabo VerdeCambodiaCameroonCanadaCaribbeanCentral AmericaChileChinaColombiaCongoCosta RicaCroatiaCubaCzechoslovakiaDenmarkDominicaDominican RepublicEastern AfricaEastern AsiaEastern EuropeEcuadorEgyptEl SalvadorEnglandEritreaEthiopiaEuropeFijiFranceGermanyGhanaGreeceGrenadaGuatemalaGuyanaHaitiHondurasHong KongHungaryIndiaIndonesiaIranIraqIrelandIsraelItalyJamaicaJapanJordanKazakhstanKenyaKoreaKuwaitLaosLatin AmericaLatviaLebanonLiberiaLithuaniaMalaysiaMexicoMicronesiaMiddle AfricaMoldovaMoroccoNepalNetherlandsNicaraguaNigeriaNorth AmericaNorth MacedoniaNorthern AfricaNorthern EuropeNorwayOceaniaPakistanPanamaPeruPhilippinesPolandPortugalRomaniaRussiaSaudi ArabiaScotlandSenegalSerbiaSierra LeoneSingaporeSomaliaSouth AfricaSouth AmericaSouth Central AsiaSouth Eastern AsiaSouthern EuropeSpainSri LankaSt. Vincent and the GrenadinesSudanSwedenSwitzerlandSyriaTaiwanThailandTrinidad and TobagoTurkeyUgandaUkraineUruguayUzbekistanVenezuelaVietnamWest IndiesWestern AfricaWestern AsiaWestern EuropeYemenZaireZimbabweAzores
College, Under 1 year
Income
Poverty
Unemployment
Labor Participation
Family Structure
Vehicle Availability
Education Level
Disability

College, Under 1 year Comparison

Danes

Swiss

Exceptional
Average
68.5%
COLLEGE, UNDER 1 YEAR
98.6/ 100
METRIC RATING
78th/ 347
METRIC RANK
65.5%
COLLEGE, UNDER 1 YEAR
53.9/ 100
METRIC RATING
173rd/ 347
METRIC RANK

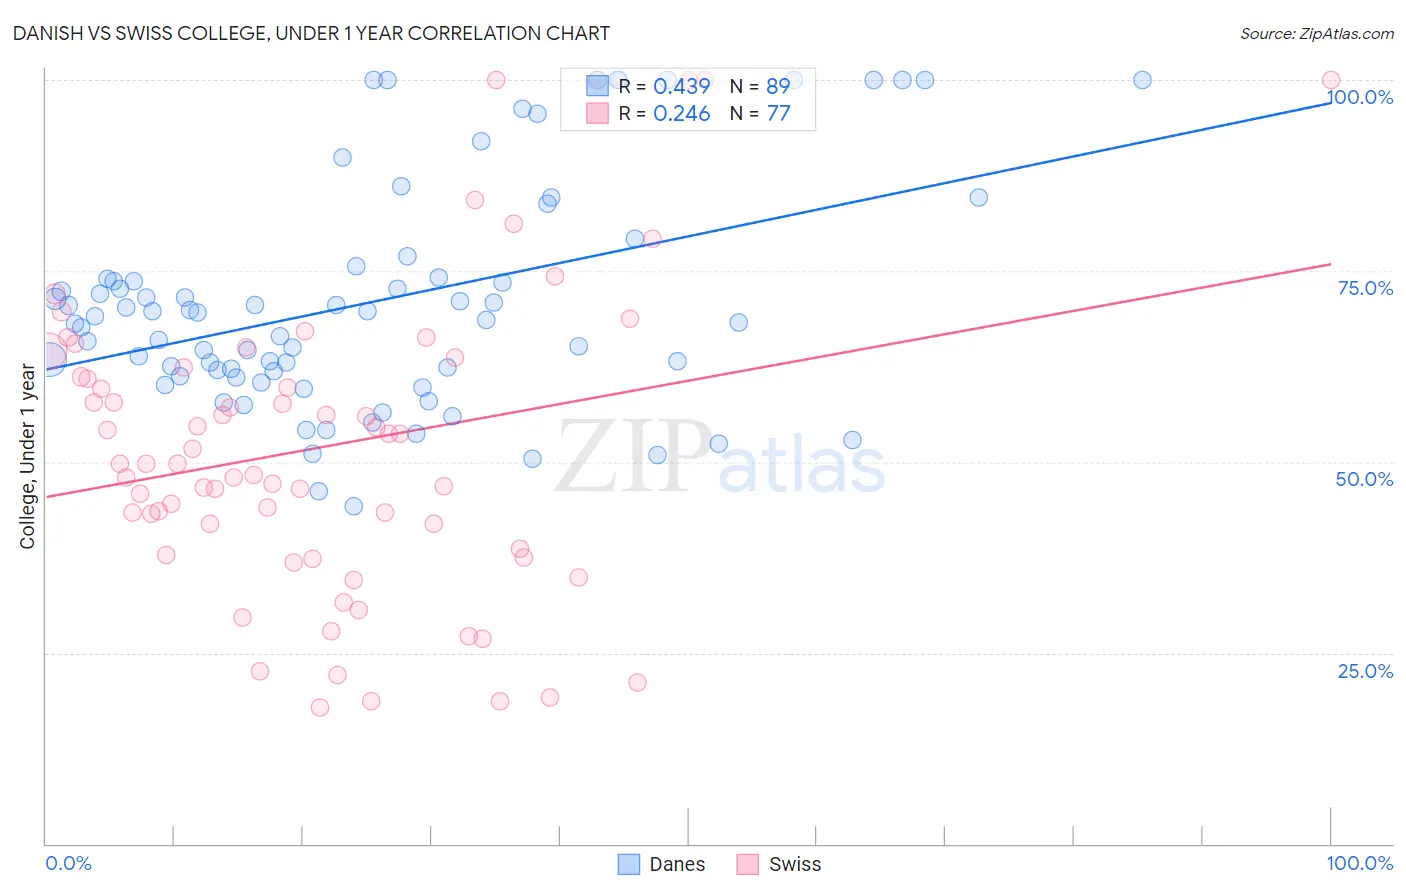
Danish vs Swiss College, Under 1 year Correlation Chart

The statistical analysis conducted on geographies consisting of 474,193,485 people shows a moderate positive correlation between the proportion of Danes and percentage of population with at least college, under 1 year education in the United States with a correlation coefficient (R) of 0.439 and weighted average of 68.5%. Similarly, the statistical analysis conducted on geographies consisting of 465,017,987 people shows a weak positive correlation between the proportion of Swiss and percentage of population with at least college, under 1 year education in the United States with a correlation coefficient (R) of 0.246 and weighted average of 65.5%, a difference of 4.5%.
Danish vs Swiss College, Under 1 year

College, Under 1 year Correlation Summary

MeasurementDanishSwiss
Minimum44.2%17.9%
Maximum100.0%100.0%
Range55.8%82.1%
Mean71.0%52.0%
Median69.1%49.7%
Interquartile 25% (IQ1)61.5%38.2%
Interquartile 75% (IQ3)74.9%63.0%
Interquartile Range (IQR)13.4%24.8%
Standard Deviation (Sample)14.8%20.0%
Standard Deviation (Population)14.7%19.9%

Similar Demographics by College, Under 1 year

Demographics Similar to Danes by College, Under 1 year

In terms of college, under 1 year, the demographic groups most similar to Danes are British (68.5%, a difference of 0.010%), Greek (68.5%, a difference of 0.010%), Immigrants from Spain (68.4%, a difference of 0.040%), Laotian (68.5%, a difference of 0.050%), and Immigrants from Western Europe (68.5%, a difference of 0.060%).
DemographicsRating | RankCollege, Under 1 year
Immigrants | Europe
99.1
/100
|
#71
Exceptional
68.8%
Bolivians
99.0
/100
|
#72
Exceptional
68.7%
Immigrants | England
99.0
/100
|
#73
Exceptional
68.7%
Swedes
98.9
/100
|
#74
Exceptional
68.7%
Immigrants | Western Europe
98.6
/100
|
#75
Exceptional
68.5%
Laotians
98.6
/100
|
#76
Exceptional
68.5%
British
98.6
/100
|
#77
Exceptional
68.5%
Danes
98.6
/100
|
#78
Exceptional
68.5%
Greeks
98.6
/100
|
#79
Exceptional
68.5%
Immigrants | Spain
98.5
/100
|
#80
Exceptional
68.4%
Immigrants | Greece
98.5
/100
|
#81
Exceptional
68.4%
Norwegians
98.4
/100
|
#82
Exceptional
68.4%
Argentineans
98.4
/100
|
#83
Exceptional
68.4%
Immigrants | Hungary
98.3
/100
|
#84
Exceptional
68.3%
Egyptians
98.3
/100
|
#85
Exceptional
68.3%

Demographics Similar to Swiss by College, Under 1 year

In terms of college, under 1 year, the demographic groups most similar to Swiss are South American Indian (65.5%, a difference of 0.020%), Immigrants from Oceania (65.6%, a difference of 0.050%), Yugoslavian (65.6%, a difference of 0.080%), German (65.6%, a difference of 0.080%), and Hungarian (65.6%, a difference of 0.090%).
DemographicsRating | RankCollege, Under 1 year
Moroccans
56.7
/100
|
#166
Average
65.6%
Immigrants | Somalia
56.4
/100
|
#167
Average
65.6%
Hungarians
55.9
/100
|
#168
Average
65.6%
Yugoslavians
55.7
/100
|
#169
Average
65.6%
Germans
55.7
/100
|
#170
Average
65.6%
Immigrants | Oceania
55.0
/100
|
#171
Average
65.6%
South American Indians
54.4
/100
|
#172
Average
65.5%
Swiss
53.9
/100
|
#173
Average
65.5%
Immigrants | Bosnia and Herzegovina
50.0
/100
|
#174
Average
65.4%
Scotch-Irish
49.5
/100
|
#175
Average
65.4%
French
48.9
/100
|
#176
Average
65.4%
Immigrants | North Macedonia
48.6
/100
|
#177
Average
65.4%
German Russians
48.3
/100
|
#178
Average
65.4%
Guamanians/Chamorros
48.2
/100
|
#179
Average
65.4%
Dutch
46.1
/100
|
#180
Average
65.3%