Danish vs Immigrants from Ghana Associate's Degree

COMPARE

Danish
Race
Ancestry
AfghanAfricanAlaska NativeAlaskan AthabascanAlbanianAleutAlsatianAmericanApacheArabArapahoArgentineanArmenianAssyrian/Chaldean/SyriacAustralianAustrianBahamianBangladeshiBarbadianBasqueBelgianBelizeanBermudanBhutaneseBlackfeetBolivianBrazilianBritishBritish West IndianBulgarianBurmeseCajunCambodianCanadianCape VerdeanCarpatho RusynCelticCentral AmericanCentral American IndianCherokeeCheyenneChickasawChileanChineseChippewaChoctawColombianColvilleComancheCosta RicanCreeCreekCroatianCrowCubanCypriotCzechCzechoslovakianDanishDelawareDominicanDutchDutch West IndianEastern EuropeanEcuadorianEgyptianEnglishEstonianEthiopianEuropeanFijianFilipinoFinnishFrenchFrench American IndianFrench CanadianGermanGerman RussianGhanaianGreekGuamanian/ChamorroGuatemalanGuyaneseHaitianHmongHonduranHopiHoumaHungarianIcelanderIndian (Asian)IndonesianInupiatIranianIraqiIrishIroquoisIsraeliItalianJamaicanJapaneseJordanianKenyanKiowaKoreanLaotianLatvianLebaneseLiberianLithuanianLumbeeLuxembourgerMacedonianMalaysianMalteseMarshalleseMenomineeMexicanMexican American IndianMongolianMoroccanNative HawaiianNavajoNepaleseNew ZealanderNicaraguanNigerianNorthern EuropeanNorwegianOkinawanOsageOttawaPaiutePakistaniPalestinianPanamanianParaguayanPennsylvania GermanPeruvianPimaPolishPortuguesePotawatomiPuebloPuerto RicanPuget Sound SalishRomanianRussianSalvadoranSamoanScandinavianScotch-IrishScottishSeminoleSenegaleseSerbianShoshoneSierra LeoneanSiouxSlavicSlovakSloveneSomaliSouth AfricanSouth AmericanSouth American IndianSoviet UnionSpaniardSpanishSpanish AmericanSpanish American IndianSri LankanSubsaharan AfricanSudaneseSwedishSwissSyrianTaiwaneseThaiTlingit-HaidaTohono O'OdhamTonganTrinidadian and TobagonianTsimshianTurkishU.S. Virgin IslanderUgandanUkrainianUruguayanUteVenezuelanVietnameseWelshWest IndianYakamaYaquiYugoslavianYumanYup'ikZimbabwean
Immigration
NonimmigrantsImmigrantsAfghanistanAfricaAlbaniaArgentinaArmeniaAsiaAustraliaAustriaBahamasBangladeshBarbadosBelarusBelgiumBelizeBoliviaBosnia and HerzegovinaBrazilBulgariaBurma/MyanmarCabo VerdeCambodiaCameroonCanadaCaribbeanCentral AmericaChileChinaColombiaCongoCosta RicaCroatiaCubaCzechoslovakiaDenmarkDominicaDominican RepublicEastern AfricaEastern AsiaEastern EuropeEcuadorEgyptEl SalvadorEnglandEritreaEthiopiaEuropeFijiFranceGermanyGreeceGrenadaGuatemalaGuyanaHaitiHondurasHong KongHungaryIndiaIndonesiaIranIraqIrelandIsraelItalyJamaicaJapanJordanKazakhstanKenyaKoreaKuwaitLaosLatin AmericaLatviaLebanonLiberiaLithuaniaMalaysiaMexicoMicronesiaMiddle AfricaMoldovaMoroccoNepalNetherlandsNicaraguaNigeriaNorth AmericaNorth MacedoniaNorthern AfricaNorthern EuropeNorwayOceaniaPakistanPanamaPeruPhilippinesPolandPortugalRomaniaRussiaSaudi ArabiaScotlandSenegalSerbiaSierra LeoneSingaporeSomaliaSouth AfricaSouth AmericaSouth Central AsiaSouth Eastern AsiaSouthern EuropeSpainSri LankaSt. Vincent and the GrenadinesSudanSwedenSwitzerlandSyriaTaiwanThailandTrinidad and TobagoTurkeyUgandaUkraineUruguayUzbekistanVenezuelaVietnamWest IndiesWestern AfricaWestern AsiaWestern EuropeYemenZaireZimbabweAzores
Immigrants from Ghana
Race
Ancestry
AfghanAfricanAlaska NativeAlaskan AthabascanAlbanianAleutAlsatianAmericanApacheArabArapahoArgentineanArmenianAssyrian/Chaldean/SyriacAustralianAustrianBahamianBangladeshiBarbadianBasqueBelgianBelizeanBermudanBhutaneseBlackfeetBolivianBrazilianBritishBritish West IndianBulgarianBurmeseCajunCambodianCanadianCape VerdeanCarpatho RusynCelticCentral AmericanCentral American IndianCherokeeCheyenneChickasawChileanChineseChippewaChoctawColombianColvilleComancheCosta RicanCreeCreekCroatianCrowCubanCypriotCzechCzechoslovakianDelawareDominicanDutchDutch West IndianEastern EuropeanEcuadorianEgyptianEnglishEstonianEthiopianEuropeanFijianFilipinoFinnishFrenchFrench American IndianFrench CanadianGermanGerman RussianGhanaianGreekGuamanian/ChamorroGuatemalanGuyaneseHaitianHmongHonduranHopiHoumaHungarianIcelanderIndian (Asian)IndonesianInupiatIranianIraqiIrishIroquoisIsraeliItalianJamaicanJapaneseJordanianKenyanKiowaKoreanLaotianLatvianLebaneseLiberianLithuanianLumbeeLuxembourgerMacedonianMalaysianMalteseMarshalleseMenomineeMexicanMexican American IndianMongolianMoroccanNative HawaiianNavajoNepaleseNew ZealanderNicaraguanNigerianNorthern EuropeanNorwegianOkinawanOsageOttawaPaiutePakistaniPalestinianPanamanianParaguayanPennsylvania GermanPeruvianPimaPolishPortuguesePotawatomiPuebloPuerto RicanPuget Sound SalishRomanianRussianSalvadoranSamoanScandinavianScotch-IrishScottishSeminoleSenegaleseSerbianShoshoneSierra LeoneanSiouxSlavicSlovakSloveneSomaliSouth AfricanSouth AmericanSouth American IndianSoviet UnionSpaniardSpanishSpanish AmericanSpanish American IndianSri LankanSubsaharan AfricanSudaneseSwedishSwissSyrianTaiwaneseThaiTlingit-HaidaTohono O'OdhamTonganTrinidadian and TobagonianTsimshianTurkishU.S. Virgin IslanderUgandanUkrainianUruguayanUteVenezuelanVietnameseWelshWest IndianYakamaYaquiYugoslavianYumanYup'ikZimbabwean
Immigration
NonimmigrantsImmigrantsAfghanistanAfricaAlbaniaArgentinaArmeniaAsiaAustraliaAustriaBahamasBangladeshBarbadosBelarusBelgiumBelizeBoliviaBosnia and HerzegovinaBrazilBulgariaBurma/MyanmarCabo VerdeCambodiaCameroonCanadaCaribbeanCentral AmericaChileChinaColombiaCongoCosta RicaCroatiaCubaCzechoslovakiaDenmarkDominicaDominican RepublicEastern AfricaEastern AsiaEastern EuropeEcuadorEgyptEl SalvadorEnglandEritreaEthiopiaEuropeFijiFranceGermanyGhanaGreeceGrenadaGuatemalaGuyanaHaitiHondurasHong KongHungaryIndiaIndonesiaIranIraqIrelandIsraelItalyJamaicaJapanJordanKazakhstanKenyaKoreaKuwaitLaosLatin AmericaLatviaLebanonLiberiaLithuaniaMalaysiaMexicoMicronesiaMiddle AfricaMoldovaMoroccoNepalNetherlandsNicaraguaNigeriaNorth AmericaNorth MacedoniaNorthern AfricaNorthern EuropeNorwayOceaniaPakistanPanamaPeruPhilippinesPolandPortugalRomaniaRussiaSaudi ArabiaScotlandSenegalSerbiaSierra LeoneSingaporeSomaliaSouth AfricaSouth AmericaSouth Central AsiaSouth Eastern AsiaSouthern EuropeSpainSri LankaSt. Vincent and the GrenadinesSudanSwedenSwitzerlandSyriaTaiwanThailandTrinidad and TobagoTurkeyUgandaUkraineUruguayUzbekistanVenezuelaVietnamWest IndiesWestern AfricaWestern AsiaWestern EuropeYemenZaireZimbabweAzores
Associate's Degree
Income
Poverty
Unemployment
Labor Participation
Family Structure
Vehicle Availability
Education Level
Disability

Associate's Degree Comparison

Danes

Immigrants from Ghana

Good
Poor
47.4%
ASSOCIATE'S DEGREE
77.3/ 100
METRIC RATING
147th/ 347
METRIC RANK
44.8%
ASSOCIATE'S DEGREE
14.2/ 100
METRIC RATING
213th/ 347
METRIC RANK

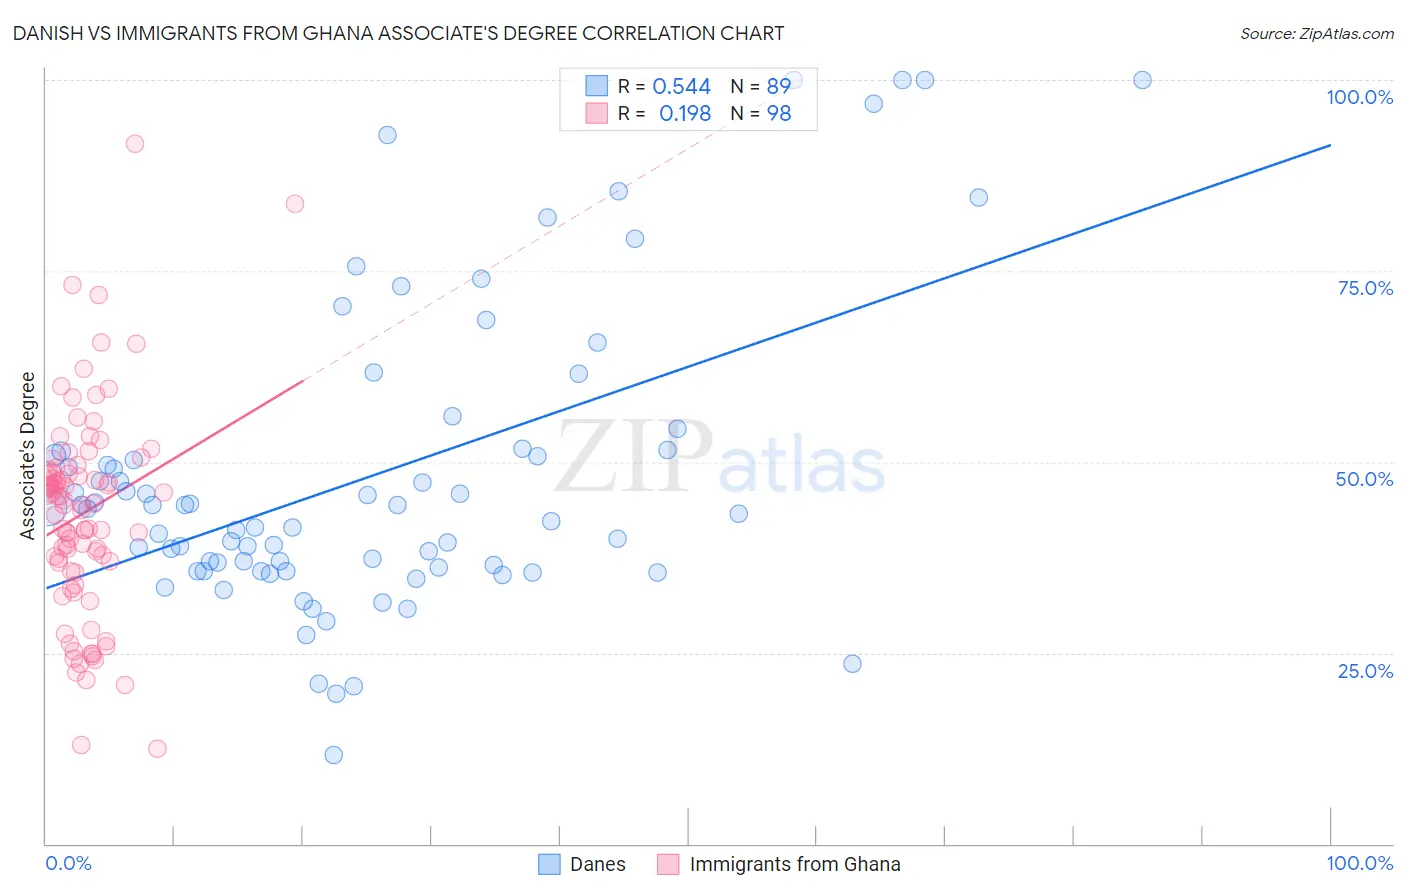
Danish vs Immigrants from Ghana Associate's Degree Correlation Chart

The statistical analysis conducted on geographies consisting of 474,170,437 people shows a substantial positive correlation between the proportion of Danes and percentage of population with at least associate's degree education in the United States with a correlation coefficient (R) of 0.544 and weighted average of 47.4%. Similarly, the statistical analysis conducted on geographies consisting of 199,944,026 people shows a poor positive correlation between the proportion of Immigrants from Ghana and percentage of population with at least associate's degree education in the United States with a correlation coefficient (R) of 0.198 and weighted average of 44.8%, a difference of 5.9%.
Danish vs Immigrants from Ghana Associate's Degree

Associate's Degree Correlation Summary

MeasurementDanishImmigrants from Ghana
Minimum11.7%12.5%
Maximum100.0%91.7%
Range88.3%79.2%
Mean48.1%43.2%
Median43.9%44.8%
Interquartile 25% (IQ1)36.0%36.9%
Interquartile 75% (IQ3)51.5%48.6%
Interquartile Range (IQR)15.5%11.7%
Standard Deviation (Sample)19.6%13.5%
Standard Deviation (Population)19.5%13.4%

Similar Demographics by Associate's Degree

Demographics Similar to Danes by Associate's Degree

In terms of associate's degree, the demographic groups most similar to Danes are Immigrants from Sudan (47.4%, a difference of 0.050%), South American Indian (47.4%, a difference of 0.060%), Immigrants from Armenia (47.4%, a difference of 0.070%), Iraqi (47.4%, a difference of 0.11%), and Immigrants from North Macedonia (47.4%, a difference of 0.14%).
DemographicsRating | RankAssociate's Degree
Immigrants | Southern Europe
84.4
/100
|
#140
Excellent
47.8%
Taiwanese
83.3
/100
|
#141
Excellent
47.7%
Sierra Leoneans
82.9
/100
|
#142
Excellent
47.7%
Norwegians
81.0
/100
|
#143
Excellent
47.6%
Slavs
80.5
/100
|
#144
Excellent
47.6%
Canadians
79.0
/100
|
#145
Good
47.5%
Immigrants | Sudan
77.9
/100
|
#146
Good
47.4%
Danes
77.3
/100
|
#147
Good
47.4%
South American Indians
76.7
/100
|
#148
Good
47.4%
Immigrants | Armenia
76.6
/100
|
#149
Good
47.4%
Iraqis
76.2
/100
|
#150
Good
47.4%
Immigrants | North Macedonia
76.0
/100
|
#151
Good
47.4%
Immigrants | Afghanistan
74.3
/100
|
#152
Good
47.3%
Czechs
72.2
/100
|
#153
Good
47.2%
Immigrants | Kenya
72.1
/100
|
#154
Good
47.2%

Demographics Similar to Immigrants from Ghana by Associate's Degree

In terms of associate's degree, the demographic groups most similar to Immigrants from Ghana are French Canadian (44.9%, a difference of 0.12%), Immigrants from Middle Africa (44.7%, a difference of 0.25%), Immigrants from Panama (44.7%, a difference of 0.31%), Immigrants from Zaire (45.0%, a difference of 0.35%), and Immigrants from Philippines (45.0%, a difference of 0.36%).
DemographicsRating | RankAssociate's Degree
German Russians
18.9
/100
|
#206
Poor
45.1%
Panamanians
18.4
/100
|
#207
Poor
45.1%
Dutch
17.6
/100
|
#208
Poor
45.0%
Immigrants | Costa Rica
16.7
/100
|
#209
Poor
45.0%
Immigrants | Philippines
16.7
/100
|
#210
Poor
45.0%
Immigrants | Zaire
16.6
/100
|
#211
Poor
45.0%
French Canadians
15.0
/100
|
#212
Poor
44.9%
Immigrants | Ghana
14.2
/100
|
#213
Poor
44.8%
Immigrants | Middle Africa
12.7
/100
|
#214
Poor
44.7%
Immigrants | Panama
12.4
/100
|
#215
Poor
44.7%
Immigrants | Nigeria
11.4
/100
|
#216
Poor
44.6%
Immigrants | Immigrants
10.5
/100
|
#217
Poor
44.5%
Spanish
9.4
/100
|
#218
Tragic
44.4%
Whites/Caucasians
7.5
/100
|
#219
Tragic
44.2%
Portuguese
7.2
/100
|
#220
Tragic
44.1%