Danish vs Apache 12th Grade, No Diploma
COMPARE
Danish
Apache
12th Grade, No Diploma
12th Grade, No Diploma Comparison
Danes
Apache
93.5%
12TH GRADE, NO DIPLOMA
100.0/ 100
METRIC RATING
13th/ 347
METRIC RANK
87.3%
12TH GRADE, NO DIPLOMA
0.0/ 100
METRIC RATING
316th/ 347
METRIC RANK
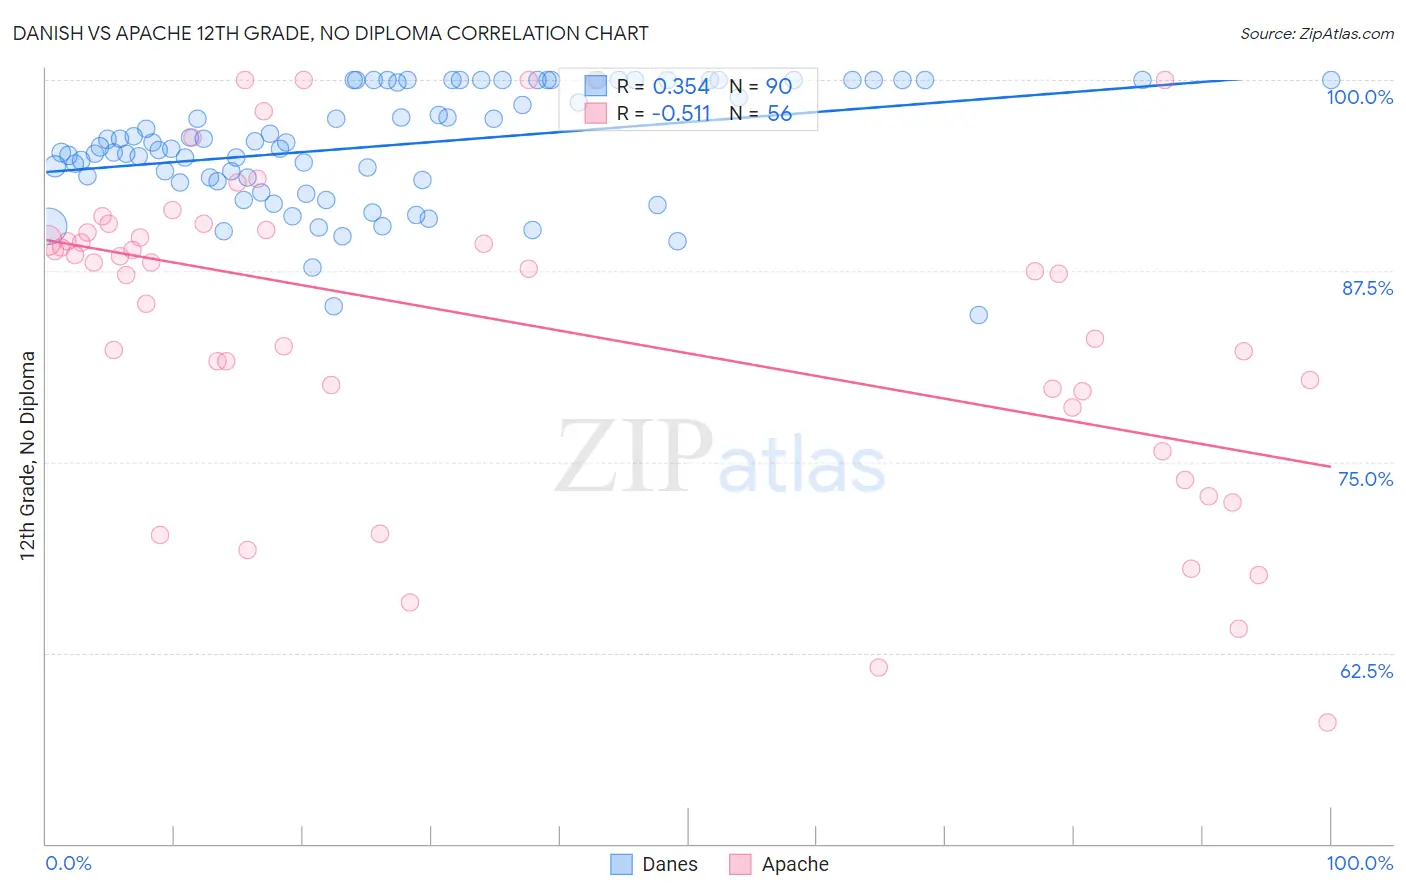
Danish vs Apache 12th Grade, No Diploma Correlation Chart
The statistical analysis conducted on geographies consisting of 474,193,674 people shows a mild positive correlation between the proportion of Danes and percentage of population with at least 12th grade (no diploma) education in the United States with a correlation coefficient (R) of 0.354 and weighted average of 93.5%. Similarly, the statistical analysis conducted on geographies consisting of 231,143,094 people shows a substantial negative correlation between the proportion of Apache and percentage of population with at least 12th grade (no diploma) education in the United States with a correlation coefficient (R) of -0.511 and weighted average of 87.3%, a difference of 7.0%.
12th Grade, No Diploma Correlation Summary
| Measurement | Danish | Apache |
| Minimum | 84.6% | 58.0% |
| Maximum | 100.0% | 100.0% |
| Range | 15.4% | 42.0% |
| Mean | 95.7% | 84.1% |
| Median | 95.7% | 87.6% |
| Interquartile 25% (IQ1) | 93.4% | 79.1% |
| Interquartile 75% (IQ3) | 100.0% | 90.1% |
| Interquartile Range (IQR) | 6.6% | 11.0% |
| Standard Deviation (Sample) | 3.7% | 10.4% |
| Standard Deviation (Population) | 3.7% | 10.4% |
Similar Demographics by 12th Grade, No Diploma
Demographics Similar to Danes by 12th Grade, No Diploma
In terms of 12th grade, no diploma, the demographic groups most similar to Danes are Eastern European (93.5%, a difference of 0.020%), Bulgarian (93.5%, a difference of 0.020%), Polish (93.5%, a difference of 0.030%), Croatian (93.5%, a difference of 0.090%), and Latvian (93.6%, a difference of 0.11%).
| Demographics | Rating | Rank | 12th Grade, No Diploma |
| Immigrants | India | 100.0 /100 | #6 | Exceptional 93.6% |
| Slovaks | 100.0 /100 | #7 | Exceptional 93.6% |
| Chinese | 100.0 /100 | #8 | Exceptional 93.6% |
| Latvians | 100.0 /100 | #9 | Exceptional 93.6% |
| Croatians | 100.0 /100 | #10 | Exceptional 93.5% |
| Poles | 100.0 /100 | #11 | Exceptional 93.5% |
| Eastern Europeans | 100.0 /100 | #12 | Exceptional 93.5% |
| Danes | 100.0 /100 | #13 | Exceptional 93.5% |
| Bulgarians | 100.0 /100 | #14 | Exceptional 93.5% |
| Finns | 100.0 /100 | #15 | Exceptional 93.4% |
| Maltese | 100.0 /100 | #16 | Exceptional 93.3% |
| Luxembourgers | 100.0 /100 | #17 | Exceptional 93.3% |
| Immigrants | Singapore | 99.9 /100 | #18 | Exceptional 93.3% |
| Germans | 99.9 /100 | #19 | Exceptional 93.3% |
| Filipinos | 99.9 /100 | #20 | Exceptional 93.2% |
Demographics Similar to Apache by 12th Grade, No Diploma
In terms of 12th grade, no diploma, the demographic groups most similar to Apache are Nicaraguan (87.3%, a difference of 0.010%), Cape Verdean (87.4%, a difference of 0.050%), Immigrants from Caribbean (87.4%, a difference of 0.070%), Immigrants from Ecuador (87.5%, a difference of 0.18%), and Yaqui (87.5%, a difference of 0.19%).
| Demographics | Rating | Rank | 12th Grade, No Diploma |
| Immigrants | Armenia | 0.0 /100 | #309 | Tragic 87.6% |
| Immigrants | Cuba | 0.0 /100 | #310 | Tragic 87.5% |
| Yaqui | 0.0 /100 | #311 | Tragic 87.5% |
| Immigrants | Ecuador | 0.0 /100 | #312 | Tragic 87.5% |
| Immigrants | Caribbean | 0.0 /100 | #313 | Tragic 87.4% |
| Cape Verdeans | 0.0 /100 | #314 | Tragic 87.4% |
| Nicaraguans | 0.0 /100 | #315 | Tragic 87.3% |
| Apache | 0.0 /100 | #316 | Tragic 87.3% |
| Navajo | 0.0 /100 | #317 | Tragic 87.1% |
| Belizeans | 0.0 /100 | #318 | Tragic 87.0% |
| Immigrants | Belize | 0.0 /100 | #319 | Tragic 87.0% |
| Immigrants | Nicaragua | 0.0 /100 | #320 | Tragic 86.6% |
| Puerto Ricans | 0.0 /100 | #321 | Tragic 86.5% |
| Central American Indians | 0.0 /100 | #322 | Tragic 86.5% |
| Yuman | 0.0 /100 | #323 | Tragic 86.5% |