Czech vs Immigrants from Micronesia Bachelor's Degree
COMPARE
Czech
Immigrants from Micronesia
Bachelor's Degree
Bachelor's Degree Comparison
Czechs
Immigrants from Micronesia
38.0%
BACHELOR'S DEGREE
54.4/ 100
METRIC RATING
170th/ 347
METRIC RANK
30.4%
BACHELOR'S DEGREE
0.0/ 100
METRIC RATING
300th/ 347
METRIC RANK
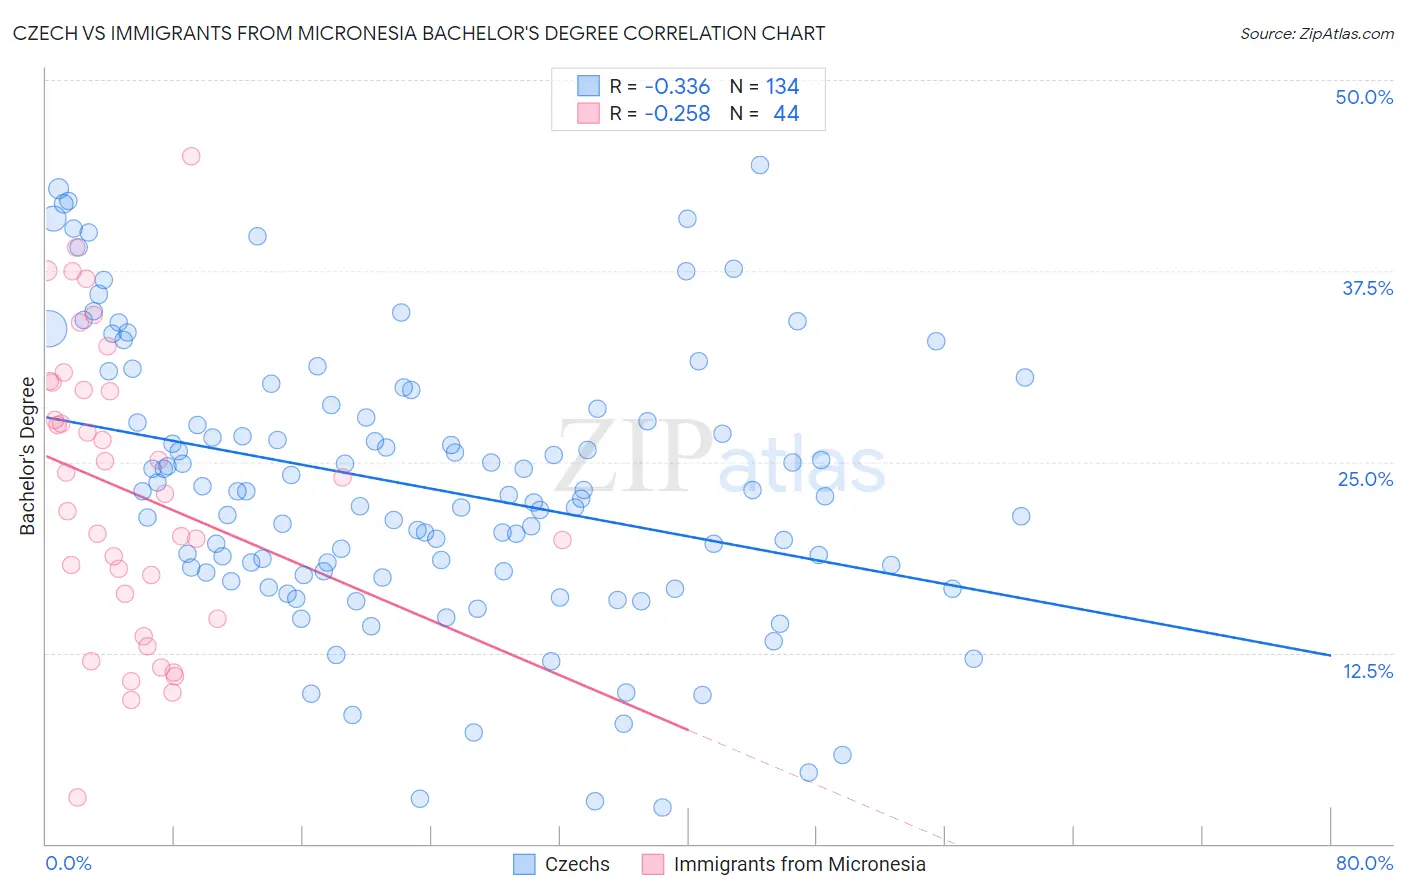
Czech vs Immigrants from Micronesia Bachelor's Degree Correlation Chart
The statistical analysis conducted on geographies consisting of 484,759,753 people shows a mild negative correlation between the proportion of Czechs and percentage of population with at least bachelor's degree education in the United States with a correlation coefficient (R) of -0.336 and weighted average of 38.0%. Similarly, the statistical analysis conducted on geographies consisting of 61,608,325 people shows a weak negative correlation between the proportion of Immigrants from Micronesia and percentage of population with at least bachelor's degree education in the United States with a correlation coefficient (R) of -0.258 and weighted average of 30.4%, a difference of 25.0%.
Bachelor's Degree Correlation Summary
| Measurement | Czech | Immigrants from Micronesia |
| Minimum | 2.4% | 3.0% |
| Maximum | 44.4% | 45.0% |
| Range | 42.1% | 42.0% |
| Mean | 23.4% | 23.1% |
| Median | 22.9% | 23.5% |
| Interquartile 25% (IQ1) | 17.8% | 15.6% |
| Interquartile 75% (IQ3) | 28.5% | 29.9% |
| Interquartile Range (IQR) | 10.6% | 14.4% |
| Standard Deviation (Sample) | 9.0% | 9.6% |
| Standard Deviation (Population) | 9.0% | 9.5% |
Similar Demographics by Bachelor's Degree
Demographics Similar to Czechs by Bachelor's Degree
In terms of bachelor's degree, the demographic groups most similar to Czechs are Bermudan (38.0%, a difference of 0.010%), Ghanaian (38.0%, a difference of 0.10%), Immigrants from Somalia (37.9%, a difference of 0.15%), Danish (38.1%, a difference of 0.18%), and Immigrants from Iraq (37.9%, a difference of 0.18%).
| Demographics | Rating | Rank | Bachelor's Degree |
| Peruvians | 63.4 /100 | #163 | Good 38.3% |
| Hungarians | 62.1 /100 | #164 | Good 38.3% |
| Sri Lankans | 59.1 /100 | #165 | Average 38.2% |
| Somalis | 58.6 /100 | #166 | Average 38.1% |
| Scottish | 56.6 /100 | #167 | Average 38.1% |
| Danes | 56.2 /100 | #168 | Average 38.1% |
| Ghanaians | 55.3 /100 | #169 | Average 38.0% |
| Czechs | 54.4 /100 | #170 | Average 38.0% |
| Bermudans | 54.2 /100 | #171 | Average 38.0% |
| Immigrants | Somalia | 52.8 /100 | #172 | Average 37.9% |
| Immigrants | Iraq | 52.5 /100 | #173 | Average 37.9% |
| Immigrants | Bangladesh | 50.0 /100 | #174 | Average 37.8% |
| Immigrants | Uruguay | 48.3 /100 | #175 | Average 37.8% |
| Costa Ricans | 47.6 /100 | #176 | Average 37.7% |
| Basques | 47.4 /100 | #177 | Average 37.7% |
Demographics Similar to Immigrants from Micronesia by Bachelor's Degree
In terms of bachelor's degree, the demographic groups most similar to Immigrants from Micronesia are Chickasaw (30.4%, a difference of 0.020%), Immigrants from Cuba (30.3%, a difference of 0.22%), Mexican American Indian (30.2%, a difference of 0.49%), Chippewa (30.6%, a difference of 0.54%), and Bangladeshi (30.2%, a difference of 0.66%).
| Demographics | Rating | Rank | Bachelor's Degree |
| Cape Verdeans | 0.1 /100 | #293 | Tragic 30.9% |
| Immigrants | Guatemala | 0.0 /100 | #294 | Tragic 30.8% |
| Immigrants | Dominican Republic | 0.0 /100 | #295 | Tragic 30.7% |
| Puget Sound Salish | 0.0 /100 | #296 | Tragic 30.7% |
| Immigrants | Haiti | 0.0 /100 | #297 | Tragic 30.6% |
| Chippewa | 0.0 /100 | #298 | Tragic 30.6% |
| Chickasaw | 0.0 /100 | #299 | Tragic 30.4% |
| Immigrants | Micronesia | 0.0 /100 | #300 | Tragic 30.4% |
| Immigrants | Cuba | 0.0 /100 | #301 | Tragic 30.3% |
| Mexican American Indians | 0.0 /100 | #302 | Tragic 30.2% |
| Bangladeshis | 0.0 /100 | #303 | Tragic 30.2% |
| Cherokee | 0.0 /100 | #304 | Tragic 30.2% |
| Immigrants | Latin America | 0.0 /100 | #305 | Tragic 30.1% |
| Immigrants | Yemen | 0.0 /100 | #306 | Tragic 29.9% |
| Nepalese | 0.0 /100 | #307 | Tragic 29.9% |