Czech vs Immigrants from Honduras 7th Grade
COMPARE
Czech
Immigrants from Honduras
7th Grade
7th Grade Comparison
Czechs
Immigrants from Honduras
97.4%
7TH GRADE
100.0/ 100
METRIC RATING
30th/ 347
METRIC RANK
92.5%
7TH GRADE
0.0/ 100
METRIC RATING
336th/ 347
METRIC RANK
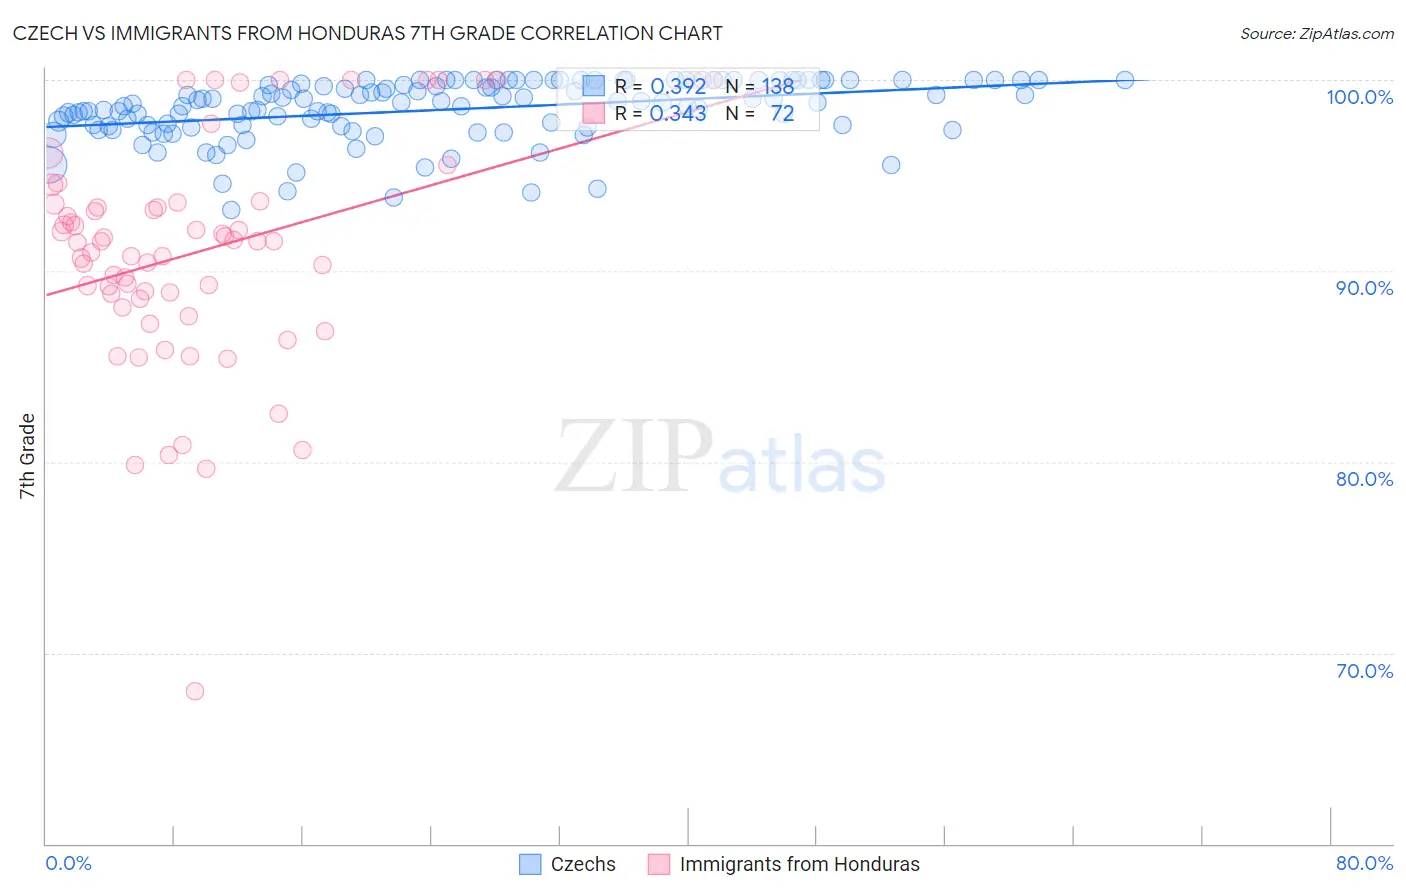
Czech vs Immigrants from Honduras 7th Grade Correlation Chart
The statistical analysis conducted on geographies consisting of 484,805,615 people shows a mild positive correlation between the proportion of Czechs and percentage of population with at least 7th grade education in the United States with a correlation coefficient (R) of 0.392 and weighted average of 97.4%. Similarly, the statistical analysis conducted on geographies consisting of 322,637,445 people shows a mild positive correlation between the proportion of Immigrants from Honduras and percentage of population with at least 7th grade education in the United States with a correlation coefficient (R) of 0.343 and weighted average of 92.5%, a difference of 5.3%.
7th Grade Correlation Summary
| Measurement | Czech | Immigrants from Honduras |
| Minimum | 93.2% | 68.0% |
| Maximum | 100.0% | 100.0% |
| Range | 6.8% | 32.0% |
| Mean | 98.4% | 91.0% |
| Median | 98.8% | 91.6% |
| Interquartile 25% (IQ1) | 97.6% | 88.7% |
| Interquartile 75% (IQ3) | 100.0% | 93.5% |
| Interquartile Range (IQR) | 2.4% | 4.9% |
| Standard Deviation (Sample) | 1.6% | 5.9% |
| Standard Deviation (Population) | 1.6% | 5.9% |
Similar Demographics by 7th Grade
Demographics Similar to Czechs by 7th Grade
In terms of 7th grade, the demographic groups most similar to Czechs are Sioux (97.4%, a difference of 0.010%), Scandinavian (97.4%, a difference of 0.010%), European (97.3%, a difference of 0.020%), Italian (97.3%, a difference of 0.020%), and Scotch-Irish (97.4%, a difference of 0.030%).
| Demographics | Rating | Rank | 7th Grade |
| Croatians | 100.0 /100 | #23 | Exceptional 97.4% |
| Welsh | 100.0 /100 | #24 | Exceptional 97.4% |
| French | 100.0 /100 | #25 | Exceptional 97.4% |
| Scotch-Irish | 100.0 /100 | #26 | Exceptional 97.4% |
| Danes | 100.0 /100 | #27 | Exceptional 97.4% |
| Sioux | 100.0 /100 | #28 | Exceptional 97.4% |
| Scandinavians | 100.0 /100 | #29 | Exceptional 97.4% |
| Czechs | 100.0 /100 | #30 | Exceptional 97.4% |
| Europeans | 100.0 /100 | #31 | Exceptional 97.3% |
| Italians | 100.0 /100 | #32 | Exceptional 97.3% |
| Chippewa | 100.0 /100 | #33 | Exceptional 97.3% |
| Alaska Natives | 100.0 /100 | #34 | Exceptional 97.3% |
| Swiss | 100.0 /100 | #35 | Exceptional 97.3% |
| Hungarians | 100.0 /100 | #36 | Exceptional 97.2% |
| British | 100.0 /100 | #37 | Exceptional 97.2% |
Demographics Similar to Immigrants from Honduras by 7th Grade
In terms of 7th grade, the demographic groups most similar to Immigrants from Honduras are Mexican American Indian (92.6%, a difference of 0.070%), Immigrants from Yemen (92.6%, a difference of 0.17%), Immigrants from Armenia (92.7%, a difference of 0.25%), Hispanic or Latino (92.7%, a difference of 0.27%), and Immigrants from Latin America (92.2%, a difference of 0.27%).
| Demographics | Rating | Rank | 7th Grade |
| Immigrants | Azores | 0.0 /100 | #329 | Tragic 93.0% |
| Immigrants | Dominican Republic | 0.0 /100 | #330 | Tragic 92.9% |
| Hondurans | 0.0 /100 | #331 | Tragic 92.9% |
| Hispanics or Latinos | 0.0 /100 | #332 | Tragic 92.7% |
| Immigrants | Armenia | 0.0 /100 | #333 | Tragic 92.7% |
| Immigrants | Yemen | 0.0 /100 | #334 | Tragic 92.6% |
| Mexican American Indians | 0.0 /100 | #335 | Tragic 92.6% |
| Immigrants | Honduras | 0.0 /100 | #336 | Tragic 92.5% |
| Immigrants | Latin America | 0.0 /100 | #337 | Tragic 92.2% |
| Central Americans | 0.0 /100 | #338 | Tragic 92.1% |
| Mexicans | 0.0 /100 | #339 | Tragic 91.9% |
| Yakama | 0.0 /100 | #340 | Tragic 91.7% |
| Guatemalans | 0.0 /100 | #341 | Tragic 91.7% |
| Salvadorans | 0.0 /100 | #342 | Tragic 91.5% |
| Immigrants | Guatemala | 0.0 /100 | #343 | Tragic 91.3% |