Czechoslovakian vs Immigrants from Sweden Professional Degree

COMPARE

Czechoslovakian
Race
Ancestry
AfghanAfricanAlaska NativeAlaskan AthabascanAlbanianAleutAlsatianAmericanApacheArabArapahoArgentineanArmenianAssyrian/Chaldean/SyriacAustralianAustrianBahamianBangladeshiBarbadianBasqueBelgianBelizeanBermudanBhutaneseBlackfeetBolivianBrazilianBritishBritish West IndianBulgarianBurmeseCajunCambodianCanadianCape VerdeanCarpatho RusynCelticCentral AmericanCentral American IndianCherokeeCheyenneChickasawChileanChineseChippewaChoctawColombianColvilleComancheCosta RicanCreeCreekCroatianCrowCubanCypriotCzechCzechoslovakianDanishDelawareDominicanDutchDutch West IndianEastern EuropeanEcuadorianEgyptianEnglishEstonianEthiopianEuropeanFijianFilipinoFinnishFrenchFrench American IndianFrench CanadianGermanGerman RussianGhanaianGreekGuamanian/ChamorroGuatemalanGuyaneseHaitianHmongHonduranHopiHoumaHungarianIcelanderIndian (Asian)IndonesianInupiatIranianIraqiIrishIroquoisIsraeliItalianJamaicanJapaneseJordanianKenyanKiowaKoreanLaotianLatvianLebaneseLiberianLithuanianLumbeeLuxembourgerMacedonianMalaysianMalteseMarshalleseMenomineeMexicanMexican American IndianMongolianMoroccanNative HawaiianNavajoNepaleseNew ZealanderNicaraguanNigerianNorthern EuropeanNorwegianOkinawanOsageOttawaPaiutePakistaniPalestinianPanamanianParaguayanPennsylvania GermanPeruvianPimaPolishPortuguesePotawatomiPuebloPuerto RicanPuget Sound SalishRomanianRussianSalvadoranSamoanScandinavianScotch-IrishScottishSeminoleSenegaleseSerbianShoshoneSierra LeoneanSiouxSlavicSlovakSloveneSomaliSouth AfricanSouth AmericanSouth American IndianSoviet UnionSpaniardSpanishSpanish AmericanSpanish American IndianSri LankanSubsaharan AfricanSudaneseSwedishSwissSyrianTaiwaneseThaiTlingit-HaidaTohono O'OdhamTonganTrinidadian and TobagonianTsimshianTurkishU.S. Virgin IslanderUgandanUkrainianUruguayanUteVenezuelanVietnameseWelshWest IndianYakamaYaquiYugoslavianYumanYup'ikZimbabwean
Immigration
NonimmigrantsImmigrantsAfghanistanAfricaAlbaniaArgentinaArmeniaAsiaAustraliaAustriaBahamasBangladeshBarbadosBelarusBelgiumBelizeBoliviaBosnia and HerzegovinaBrazilBulgariaBurma/MyanmarCabo VerdeCambodiaCameroonCanadaCaribbeanCentral AmericaChileChinaColombiaCongoCosta RicaCroatiaCubaCzechoslovakiaDenmarkDominicaDominican RepublicEastern AfricaEastern AsiaEastern EuropeEcuadorEgyptEl SalvadorEnglandEritreaEthiopiaEuropeFijiFranceGermanyGhanaGreeceGrenadaGuatemalaGuyanaHaitiHondurasHong KongHungaryIndiaIndonesiaIranIraqIrelandIsraelItalyJamaicaJapanJordanKazakhstanKenyaKoreaKuwaitLaosLatin AmericaLatviaLebanonLiberiaLithuaniaMalaysiaMexicoMicronesiaMiddle AfricaMoldovaMoroccoNepalNetherlandsNicaraguaNigeriaNorth AmericaNorth MacedoniaNorthern AfricaNorthern EuropeNorwayOceaniaPakistanPanamaPeruPhilippinesPolandPortugalRomaniaRussiaSaudi ArabiaScotlandSenegalSerbiaSierra LeoneSingaporeSomaliaSouth AfricaSouth AmericaSouth Central AsiaSouth Eastern AsiaSouthern EuropeSpainSri LankaSt. Vincent and the GrenadinesSudanSwitzerlandSyriaTaiwanThailandTrinidad and TobagoTurkeyUgandaUkraineUruguayUzbekistanVenezuelaVietnamWest IndiesWestern AfricaWestern AsiaWestern EuropeYemenZaireZimbabweAzores
Immigrants from Sweden
Race
Ancestry
AfghanAfricanAlaska NativeAlaskan AthabascanAlbanianAleutAlsatianAmericanApacheArabArapahoArgentineanArmenianAssyrian/Chaldean/SyriacAustralianAustrianBahamianBangladeshiBarbadianBasqueBelgianBelizeanBermudanBhutaneseBlackfeetBolivianBrazilianBritishBritish West IndianBulgarianBurmeseCajunCambodianCanadianCape VerdeanCarpatho RusynCelticCentral AmericanCentral American IndianCherokeeCheyenneChickasawChileanChineseChippewaChoctawColombianColvilleComancheCosta RicanCreeCreekCroatianCrowCubanCypriotCzechDanishDelawareDominicanDutchDutch West IndianEastern EuropeanEcuadorianEgyptianEnglishEstonianEthiopianEuropeanFijianFilipinoFinnishFrenchFrench American IndianFrench CanadianGermanGerman RussianGhanaianGreekGuamanian/ChamorroGuatemalanGuyaneseHaitianHmongHonduranHopiHoumaHungarianIcelanderIndian (Asian)IndonesianInupiatIranianIraqiIrishIroquoisIsraeliItalianJamaicanJapaneseJordanianKenyanKiowaKoreanLaotianLatvianLebaneseLiberianLithuanianLumbeeLuxembourgerMacedonianMalaysianMalteseMarshalleseMenomineeMexicanMexican American IndianMongolianMoroccanNative HawaiianNavajoNepaleseNew ZealanderNicaraguanNigerianNorthern EuropeanNorwegianOkinawanOsageOttawaPaiutePakistaniPalestinianPanamanianParaguayanPennsylvania GermanPeruvianPimaPolishPortuguesePotawatomiPuebloPuerto RicanPuget Sound SalishRomanianRussianSalvadoranSamoanScandinavianScotch-IrishScottishSeminoleSenegaleseSerbianShoshoneSierra LeoneanSiouxSlavicSlovakSloveneSomaliSouth AfricanSouth AmericanSouth American IndianSoviet UnionSpaniardSpanishSpanish AmericanSpanish American IndianSri LankanSubsaharan AfricanSudaneseSwedishSwissSyrianTaiwaneseThaiTlingit-HaidaTohono O'OdhamTonganTrinidadian and TobagonianTsimshianTurkishU.S. Virgin IslanderUgandanUkrainianUruguayanUteVenezuelanVietnameseWelshWest IndianYakamaYaquiYugoslavianYumanYup'ikZimbabwean
Immigration
NonimmigrantsImmigrantsAfghanistanAfricaAlbaniaArgentinaArmeniaAsiaAustraliaAustriaBahamasBangladeshBarbadosBelarusBelgiumBelizeBoliviaBosnia and HerzegovinaBrazilBulgariaBurma/MyanmarCabo VerdeCambodiaCameroonCanadaCaribbeanCentral AmericaChileChinaColombiaCongoCosta RicaCroatiaCubaCzechoslovakiaDenmarkDominicaDominican RepublicEastern AfricaEastern AsiaEastern EuropeEcuadorEgyptEl SalvadorEnglandEritreaEthiopiaEuropeFijiFranceGermanyGhanaGreeceGrenadaGuatemalaGuyanaHaitiHondurasHong KongHungaryIndiaIndonesiaIranIraqIrelandIsraelItalyJamaicaJapanJordanKazakhstanKenyaKoreaKuwaitLaosLatin AmericaLatviaLebanonLiberiaLithuaniaMalaysiaMexicoMicronesiaMiddle AfricaMoldovaMoroccoNepalNetherlandsNicaraguaNigeriaNorth AmericaNorth MacedoniaNorthern AfricaNorthern EuropeNorwayOceaniaPakistanPanamaPeruPhilippinesPolandPortugalRomaniaRussiaSaudi ArabiaScotlandSenegalSerbiaSierra LeoneSingaporeSomaliaSouth AfricaSouth AmericaSouth Central AsiaSouth Eastern AsiaSouthern EuropeSpainSri LankaSt. Vincent and the GrenadinesSudanSwedenSwitzerlandSyriaTaiwanThailandTrinidad and TobagoTurkeyUgandaUkraineUruguayUzbekistanVenezuelaVietnamWest IndiesWestern AfricaWestern AsiaWestern EuropeYemenZaireZimbabweAzores
Professional Degree
Income
Poverty
Unemployment
Labor Participation
Family Structure
Vehicle Availability
Education Level
Disability

Professional Degree Comparison

Czechoslovakians

Immigrants from Sweden

Fair
Exceptional
4.2%
PROFESSIONAL DEGREE
22.4/ 100
METRIC RATING
197th/ 347
METRIC RANK
6.7%
PROFESSIONAL DEGREE
100.0/ 100
METRIC RATING
16th/ 347
METRIC RANK

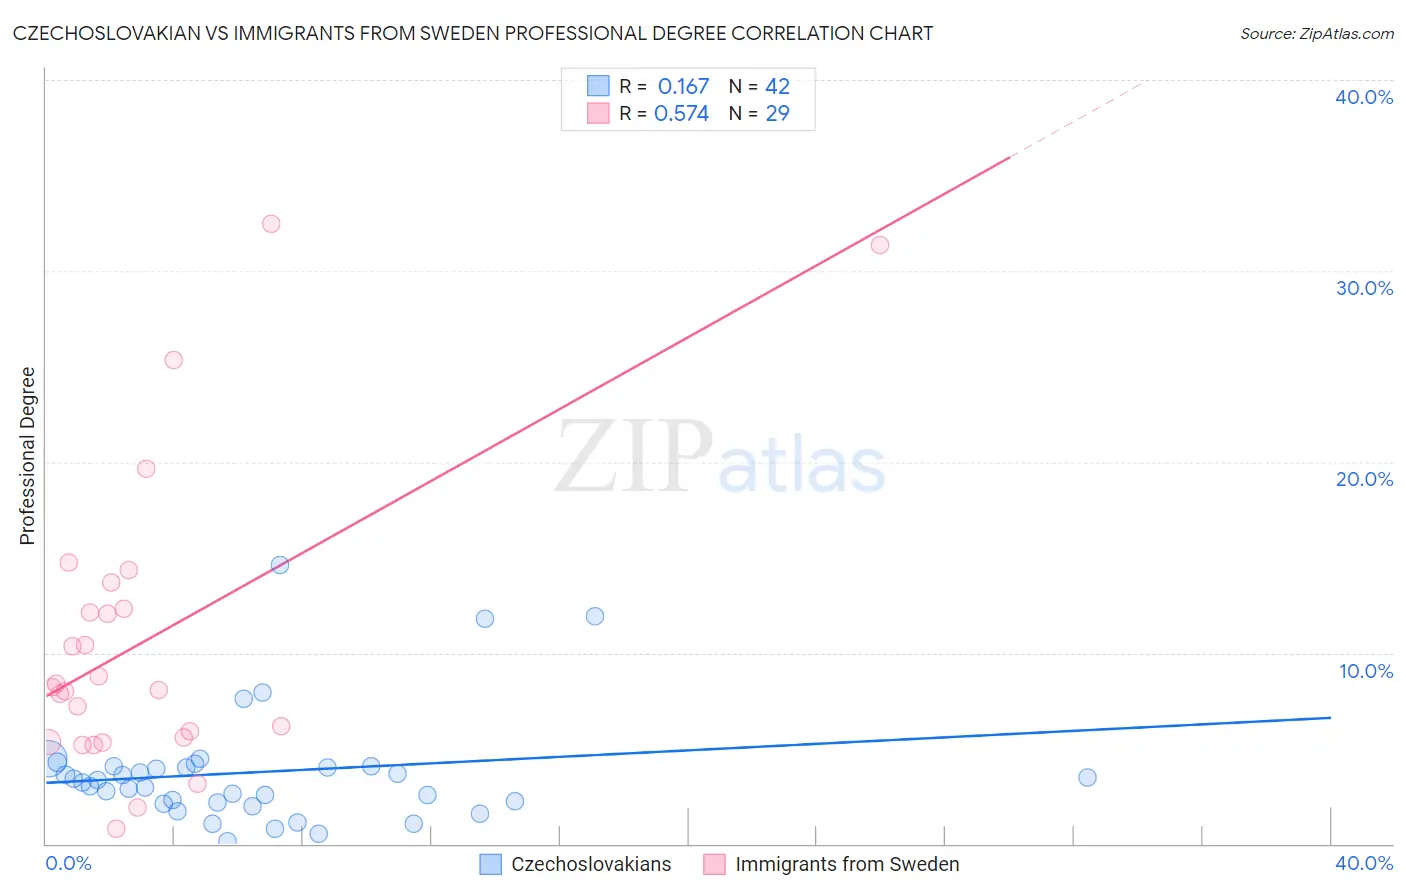
Czechoslovakian vs Immigrants from Sweden Professional Degree Correlation Chart

The statistical analysis conducted on geographies consisting of 367,571,969 people shows a poor positive correlation between the proportion of Czechoslovakians and percentage of population with at least professional degree education in the United States with a correlation coefficient (R) of 0.167 and weighted average of 4.2%. Similarly, the statistical analysis conducted on geographies consisting of 164,659,960 people shows a substantial positive correlation between the proportion of Immigrants from Sweden and percentage of population with at least professional degree education in the United States with a correlation coefficient (R) of 0.574 and weighted average of 6.7%, a difference of 59.2%.
Czechoslovakian vs Immigrants from Sweden Professional Degree

Professional Degree Correlation Summary

MeasurementCzechoslovakianImmigrants from Sweden
Minimum0.10%0.79%
Maximum14.6%32.5%
Range14.5%31.7%
Mean3.7%10.7%
Median3.3%8.2%
Interquartile 25% (IQ1)2.2%5.5%
Interquartile 75% (IQ3)4.0%13.0%
Interquartile Range (IQR)1.9%7.5%
Standard Deviation (Sample)3.0%7.8%
Standard Deviation (Population)3.0%7.7%

Similar Demographics by Professional Degree

Demographics Similar to Czechoslovakians by Professional Degree

In terms of professional degree, the demographic groups most similar to Czechoslovakians are Immigrants from Middle Africa (4.2%, a difference of 0.050%), Spanish (4.2%, a difference of 0.14%), Norwegian (4.2%, a difference of 0.42%), Nigerian (4.2%, a difference of 0.47%), and Immigrants from North Macedonia (4.2%, a difference of 0.50%).
DemographicsRating | RankProfessional Degree
Immigrants | Poland
29.2
/100
|
#190
Fair
4.3%
Sri Lankans
29.0
/100
|
#191
Fair
4.3%
Ghanaians
27.3
/100
|
#192
Fair
4.3%
French
27.1
/100
|
#193
Fair
4.2%
Scandinavians
25.8
/100
|
#194
Fair
4.2%
Nigerians
24.6
/100
|
#195
Fair
4.2%
Spanish
23.0
/100
|
#196
Fair
4.2%
Czechoslovakians
22.4
/100
|
#197
Fair
4.2%
Immigrants | Middle Africa
22.1
/100
|
#198
Fair
4.2%
Norwegians
20.5
/100
|
#199
Fair
4.2%
Immigrants | North Macedonia
20.2
/100
|
#200
Fair
4.2%
Finns
18.7
/100
|
#201
Poor
4.2%
Immigrants | Iraq
17.1
/100
|
#202
Poor
4.2%
Panamanians
15.9
/100
|
#203
Poor
4.1%
Barbadians
15.8
/100
|
#204
Poor
4.1%

Demographics Similar to Immigrants from Sweden by Professional Degree

In terms of professional degree, the demographic groups most similar to Immigrants from Sweden are Immigrants from China (6.7%, a difference of 0.45%), Immigrants from France (6.8%, a difference of 1.5%), Immigrants from Eastern Asia (6.6%, a difference of 2.0%), Soviet Union (6.6%, a difference of 2.0%), and Indian (Asian) (6.5%, a difference of 2.7%).
DemographicsRating | RankProfessional Degree
Immigrants | Taiwan
100.0
/100
|
#9
Exceptional
7.1%
Immigrants | Belgium
100.0
/100
|
#10
Exceptional
7.0%
Cypriots
100.0
/100
|
#11
Exceptional
6.9%
Israelis
100.0
/100
|
#12
Exceptional
6.9%
Immigrants | Australia
100.0
/100
|
#13
Exceptional
6.9%
Immigrants | France
100.0
/100
|
#14
Exceptional
6.8%
Immigrants | China
100.0
/100
|
#15
Exceptional
6.7%
Immigrants | Sweden
100.0
/100
|
#16
Exceptional
6.7%
Immigrants | Eastern Asia
100.0
/100
|
#17
Exceptional
6.6%
Soviet Union
100.0
/100
|
#18
Exceptional
6.6%
Indians (Asian)
100.0
/100
|
#19
Exceptional
6.5%
Immigrants | Denmark
100.0
/100
|
#20
Exceptional
6.4%
Immigrants | Hong Kong
100.0
/100
|
#21
Exceptional
6.4%
Immigrants | Japan
100.0
/100
|
#22
Exceptional
6.4%
Russians
100.0
/100
|
#23
Exceptional
6.3%