Cypriot vs Immigrants from Laos 9th Grade
COMPARE
Cypriot
Immigrants from Laos
9th Grade
9th Grade Comparison
Cypriots
Immigrants from Laos
95.8%
9TH GRADE
99.6/ 100
METRIC RATING
67th/ 347
METRIC RANK
93.2%
9TH GRADE
0.0/ 100
METRIC RATING
292nd/ 347
METRIC RANK
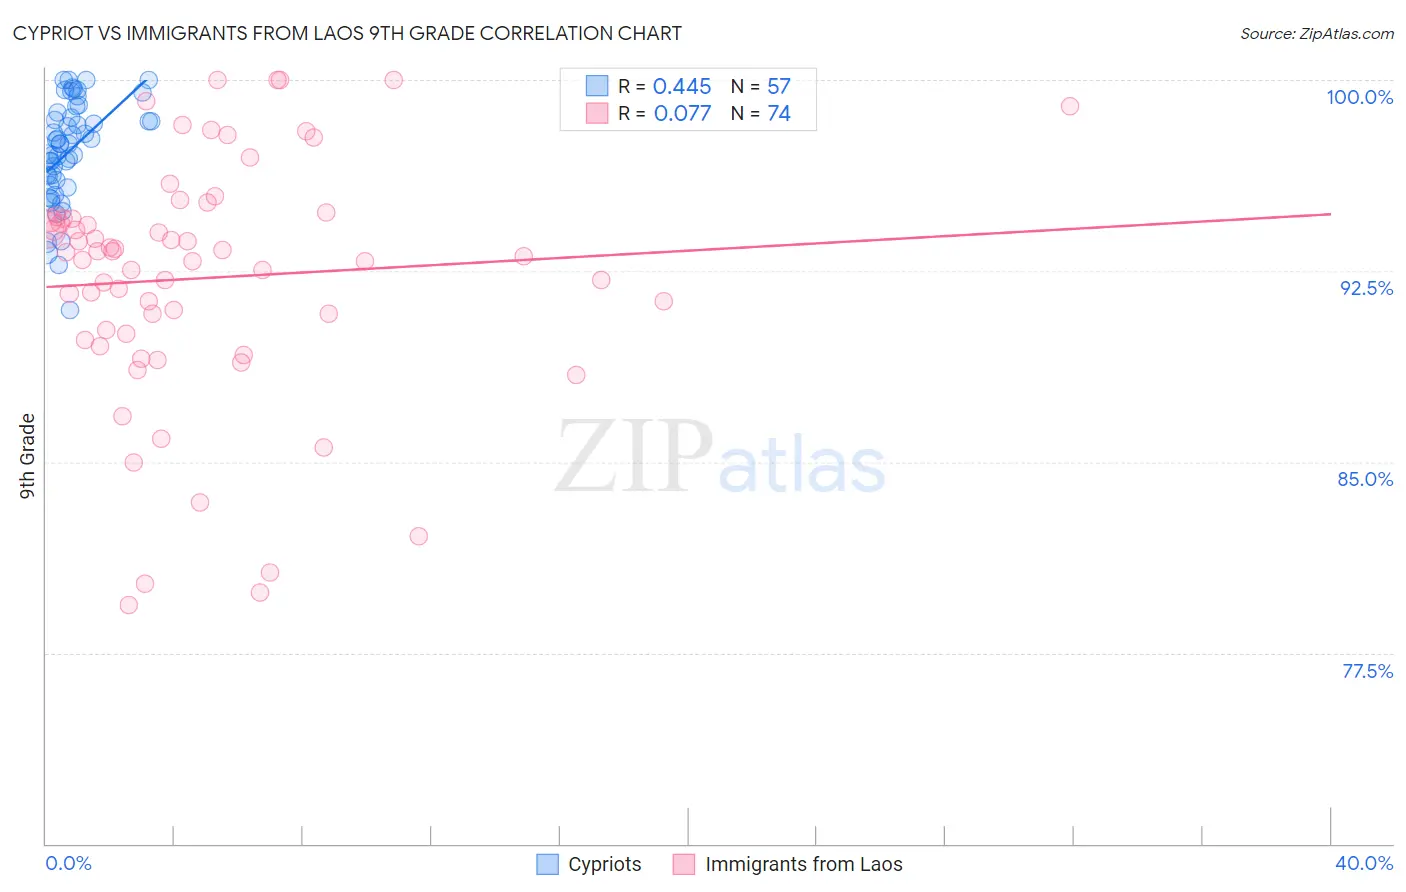
Cypriot vs Immigrants from Laos 9th Grade Correlation Chart
The statistical analysis conducted on geographies consisting of 61,870,289 people shows a moderate positive correlation between the proportion of Cypriots and percentage of population with at least 9th grade education in the United States with a correlation coefficient (R) of 0.445 and weighted average of 95.8%. Similarly, the statistical analysis conducted on geographies consisting of 201,472,886 people shows a slight positive correlation between the proportion of Immigrants from Laos and percentage of population with at least 9th grade education in the United States with a correlation coefficient (R) of 0.077 and weighted average of 93.2%, a difference of 2.8%.
9th Grade Correlation Summary
| Measurement | Cypriot | Immigrants from Laos |
| Minimum | 91.0% | 79.4% |
| Maximum | 100.0% | 100.0% |
| Range | 9.0% | 20.6% |
| Mean | 97.2% | 92.2% |
| Median | 97.5% | 93.1% |
| Interquartile 25% (IQ1) | 96.0% | 90.0% |
| Interquartile 75% (IQ3) | 98.6% | 94.6% |
| Interquartile Range (IQR) | 2.6% | 4.5% |
| Standard Deviation (Sample) | 2.0% | 4.8% |
| Standard Deviation (Population) | 2.0% | 4.8% |
Similar Demographics by 9th Grade
Demographics Similar to Cypriots by 9th Grade
In terms of 9th grade, the demographic groups most similar to Cypriots are Immigrants from Ireland (95.8%, a difference of 0.0%), Immigrants from Lithuania (95.8%, a difference of 0.0%), Immigrants from Netherlands (95.8%, a difference of 0.010%), Immigrants from England (95.9%, a difference of 0.020%), and Immigrants from Australia (95.8%, a difference of 0.020%).
| Demographics | Rating | Rank | 9th Grade |
| Native Hawaiians | 99.8 /100 | #60 | Exceptional 95.9% |
| Sioux | 99.8 /100 | #61 | Exceptional 95.9% |
| Ukrainians | 99.7 /100 | #62 | Exceptional 95.9% |
| Canadians | 99.7 /100 | #63 | Exceptional 95.9% |
| Zimbabweans | 99.7 /100 | #64 | Exceptional 95.9% |
| Immigrants | England | 99.6 /100 | #65 | Exceptional 95.9% |
| Immigrants | Netherlands | 99.6 /100 | #66 | Exceptional 95.8% |
| Cypriots | 99.6 /100 | #67 | Exceptional 95.8% |
| Immigrants | Ireland | 99.6 /100 | #68 | Exceptional 95.8% |
| Immigrants | Lithuania | 99.6 /100 | #69 | Exceptional 95.8% |
| Immigrants | Australia | 99.5 /100 | #70 | Exceptional 95.8% |
| Immigrants | Belgium | 99.5 /100 | #71 | Exceptional 95.8% |
| Turks | 99.5 /100 | #72 | Exceptional 95.8% |
| Immigrants | Singapore | 99.5 /100 | #73 | Exceptional 95.8% |
| Thais | 99.5 /100 | #74 | Exceptional 95.8% |
Demographics Similar to Immigrants from Laos by 9th Grade
In terms of 9th grade, the demographic groups most similar to Immigrants from Laos are Sri Lankan (93.2%, a difference of 0.010%), British West Indian (93.2%, a difference of 0.020%), Cuban (93.2%, a difference of 0.020%), Immigrants from Burma/Myanmar (93.1%, a difference of 0.040%), and Indonesian (93.1%, a difference of 0.040%).
| Demographics | Rating | Rank | 9th Grade |
| Immigrants | Peru | 0.0 /100 | #285 | Tragic 93.4% |
| Immigrants | Barbados | 0.0 /100 | #286 | Tragic 93.4% |
| Immigrants | St. Vincent and the Grenadines | 0.0 /100 | #287 | Tragic 93.4% |
| Immigrants | South Eastern Asia | 0.0 /100 | #288 | Tragic 93.3% |
| Immigrants | West Indies | 0.0 /100 | #289 | Tragic 93.3% |
| Pennsylvania Germans | 0.0 /100 | #290 | Tragic 93.3% |
| British West Indians | 0.0 /100 | #291 | Tragic 93.2% |
| Immigrants | Laos | 0.0 /100 | #292 | Tragic 93.2% |
| Sri Lankans | 0.0 /100 | #293 | Tragic 93.2% |
| Cubans | 0.0 /100 | #294 | Tragic 93.2% |
| Immigrants | Burma/Myanmar | 0.0 /100 | #295 | Tragic 93.1% |
| Indonesians | 0.0 /100 | #296 | Tragic 93.1% |
| Fijians | 0.0 /100 | #297 | Tragic 93.1% |
| Haitians | 0.0 /100 | #298 | Tragic 93.1% |
| Immigrants | Grenada | 0.0 /100 | #299 | Tragic 93.0% |