Cuban vs Albanian No Schooling Completed
COMPARE
Cuban
Albanian
No Schooling Completed
No Schooling Completed Comparison
Cubans
Albanians
2.5%
NO SCHOOLING COMPLETED
0.2/ 100
METRIC RATING
271st/ 347
METRIC RANK
2.1%
NO SCHOOLING COMPLETED
62.2/ 100
METRIC RATING
163rd/ 347
METRIC RANK
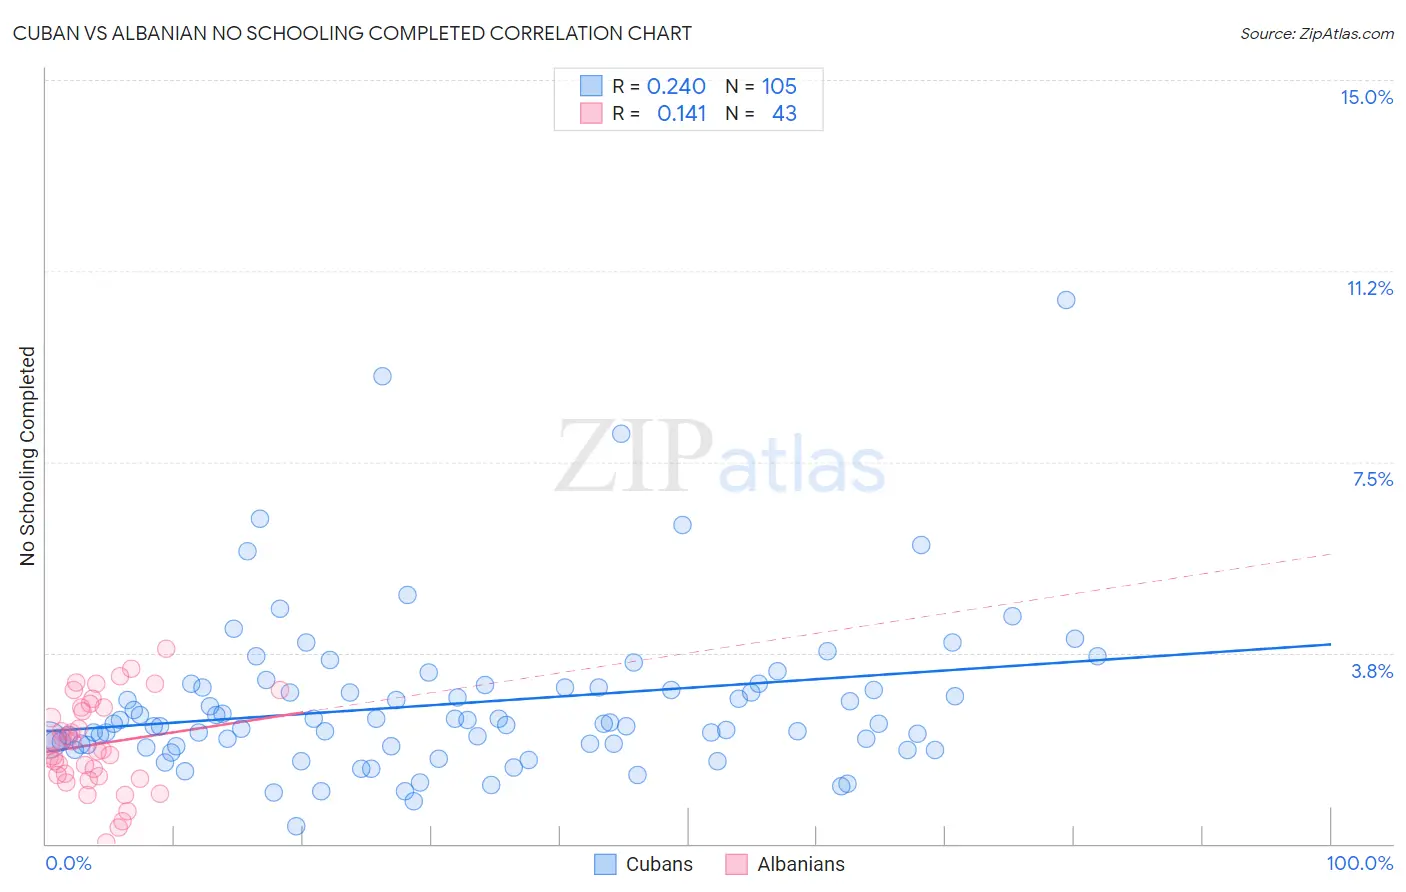
Cuban vs Albanian No Schooling Completed Correlation Chart
The statistical analysis conducted on geographies consisting of 444,053,579 people shows a weak positive correlation between the proportion of Cubans and percentage of population with no schooling in the United States with a correlation coefficient (R) of 0.240 and weighted average of 2.5%. Similarly, the statistical analysis conducted on geographies consisting of 192,057,216 people shows a poor positive correlation between the proportion of Albanians and percentage of population with no schooling in the United States with a correlation coefficient (R) of 0.141 and weighted average of 2.1%, a difference of 22.3%.
No Schooling Completed Correlation Summary
| Measurement | Cuban | Albanian |
| Minimum | 0.33% | 0.028% |
| Maximum | 10.7% | 3.8% |
| Range | 10.4% | 3.8% |
| Mean | 2.8% | 2.0% |
| Median | 2.4% | 1.9% |
| Interquartile 25% (IQ1) | 1.9% | 1.3% |
| Interquartile 75% (IQ3) | 3.1% | 2.7% |
| Interquartile Range (IQR) | 1.1% | 1.3% |
| Standard Deviation (Sample) | 1.6% | 0.90% |
| Standard Deviation (Population) | 1.6% | 0.89% |
Similar Demographics by No Schooling Completed
Demographics Similar to Cubans by No Schooling Completed
In terms of no schooling completed, the demographic groups most similar to Cubans are Immigrants from Peru (2.5%, a difference of 0.010%), Immigrants from Nigeria (2.5%, a difference of 0.090%), Immigrants from Bolivia (2.5%, a difference of 0.53%), Taiwanese (2.5%, a difference of 0.95%), and Yuman (2.5%, a difference of 1.2%).
| Demographics | Rating | Rank | No Schooling Completed |
| Indians (Asian) | 0.4 /100 | #264 | Tragic 2.5% |
| West Indians | 0.4 /100 | #265 | Tragic 2.5% |
| Fijians | 0.4 /100 | #266 | Tragic 2.5% |
| Yuman | 0.4 /100 | #267 | Tragic 2.5% |
| Taiwanese | 0.3 /100 | #268 | Tragic 2.5% |
| Immigrants | Nigeria | 0.2 /100 | #269 | Tragic 2.5% |
| Immigrants | Peru | 0.2 /100 | #270 | Tragic 2.5% |
| Cubans | 0.2 /100 | #271 | Tragic 2.5% |
| Immigrants | Bolivia | 0.2 /100 | #272 | Tragic 2.5% |
| Immigrants | Cameroon | 0.1 /100 | #273 | Tragic 2.5% |
| Ghanaians | 0.1 /100 | #274 | Tragic 2.6% |
| Immigrants | China | 0.1 /100 | #275 | Tragic 2.6% |
| Immigrants | Western Africa | 0.1 /100 | #276 | Tragic 2.6% |
| Immigrants | Philippines | 0.1 /100 | #277 | Tragic 2.6% |
| Immigrants | Uzbekistan | 0.1 /100 | #278 | Tragic 2.6% |
Demographics Similar to Albanians by No Schooling Completed
In terms of no schooling completed, the demographic groups most similar to Albanians are Comanche (2.1%, a difference of 0.22%), Immigrants from Brazil (2.1%, a difference of 0.24%), Brazilian (2.1%, a difference of 0.28%), Dutch West Indian (2.1%, a difference of 0.33%), and Ugandan (2.0%, a difference of 0.35%).
| Demographics | Rating | Rank | No Schooling Completed |
| Chileans | 67.2 /100 | #156 | Good 2.0% |
| Immigrants | Sri Lanka | 67.0 /100 | #157 | Good 2.0% |
| Immigrants | Korea | 66.7 /100 | #158 | Good 2.0% |
| Immigrants | Spain | 66.4 /100 | #159 | Good 2.0% |
| Kenyans | 65.7 /100 | #160 | Good 2.0% |
| Ugandans | 64.6 /100 | #161 | Good 2.0% |
| Immigrants | Brazil | 63.8 /100 | #162 | Good 2.1% |
| Albanians | 62.2 /100 | #163 | Good 2.1% |
| Comanche | 60.7 /100 | #164 | Good 2.1% |
| Brazilians | 60.2 /100 | #165 | Good 2.1% |
| Dutch West Indians | 59.9 /100 | #166 | Average 2.1% |
| Egyptians | 59.2 /100 | #167 | Average 2.1% |
| Cheyenne | 58.6 /100 | #168 | Average 2.1% |
| Apache | 56.7 /100 | #169 | Average 2.1% |
| Argentineans | 56.0 /100 | #170 | Average 2.1% |