Crow vs Immigrants from Iraq 3rd Grade

COMPARE

Crow
Race
Ancestry
AfghanAfricanAlaska NativeAlaskan AthabascanAlbanianAleutAlsatianAmericanApacheArabArapahoArgentineanArmenianAssyrian/Chaldean/SyriacAustralianAustrianBahamianBangladeshiBarbadianBasqueBelgianBelizeanBermudanBhutaneseBlackfeetBolivianBrazilianBritishBritish West IndianBulgarianBurmeseCajunCambodianCanadianCape VerdeanCarpatho RusynCelticCentral AmericanCentral American IndianCherokeeCheyenneChickasawChileanChineseChippewaChoctawColombianColvilleComancheCosta RicanCreeCreekCroatianCrowCubanCypriotCzechCzechoslovakianDanishDelawareDominicanDutchDutch West IndianEastern EuropeanEcuadorianEgyptianEnglishEstonianEthiopianEuropeanFijianFilipinoFinnishFrenchFrench American IndianFrench CanadianGermanGerman RussianGhanaianGreekGuamanian/ChamorroGuatemalanGuyaneseHaitianHmongHonduranHopiHoumaHungarianIcelanderIndian (Asian)IndonesianInupiatIranianIraqiIrishIroquoisIsraeliItalianJamaicanJapaneseJordanianKenyanKiowaKoreanLaotianLatvianLebaneseLiberianLithuanianLumbeeLuxembourgerMacedonianMalaysianMalteseMarshalleseMenomineeMexicanMexican American IndianMongolianMoroccanNative HawaiianNavajoNepaleseNew ZealanderNicaraguanNigerianNorthern EuropeanNorwegianOkinawanOsageOttawaPaiutePakistaniPalestinianPanamanianParaguayanPennsylvania GermanPeruvianPimaPolishPortuguesePotawatomiPuebloPuerto RicanPuget Sound SalishRomanianRussianSalvadoranSamoanScandinavianScotch-IrishScottishSeminoleSenegaleseSerbianShoshoneSierra LeoneanSiouxSlavicSlovakSloveneSomaliSouth AfricanSouth AmericanSouth American IndianSoviet UnionSpaniardSpanishSpanish AmericanSpanish American IndianSri LankanSubsaharan AfricanSudaneseSwedishSwissSyrianTaiwaneseThaiTlingit-HaidaTohono O'OdhamTonganTrinidadian and TobagonianTsimshianTurkishU.S. Virgin IslanderUgandanUkrainianUruguayanUteVenezuelanVietnameseWelshWest IndianYakamaYaquiYugoslavianYumanYup'ikZimbabwean
Immigration
NonimmigrantsImmigrantsAfghanistanAfricaAlbaniaArgentinaArmeniaAsiaAustraliaAustriaBahamasBangladeshBarbadosBelarusBelgiumBelizeBoliviaBosnia and HerzegovinaBrazilBulgariaBurma/MyanmarCabo VerdeCambodiaCameroonCanadaCaribbeanCentral AmericaChileChinaColombiaCongoCosta RicaCroatiaCubaCzechoslovakiaDenmarkDominicaDominican RepublicEastern AfricaEastern AsiaEastern EuropeEcuadorEgyptEl SalvadorEnglandEritreaEthiopiaEuropeFijiFranceGermanyGhanaGreeceGrenadaGuatemalaGuyanaHaitiHondurasHong KongHungaryIndiaIndonesiaIranIrelandIsraelItalyJamaicaJapanJordanKazakhstanKenyaKoreaKuwaitLaosLatin AmericaLatviaLebanonLiberiaLithuaniaMalaysiaMexicoMicronesiaMiddle AfricaMoldovaMoroccoNepalNetherlandsNicaraguaNigeriaNorth AmericaNorth MacedoniaNorthern AfricaNorthern EuropeNorwayOceaniaPakistanPanamaPeruPhilippinesPolandPortugalRomaniaRussiaSaudi ArabiaScotlandSenegalSerbiaSierra LeoneSingaporeSomaliaSouth AfricaSouth AmericaSouth Central AsiaSouth Eastern AsiaSouthern EuropeSpainSri LankaSt. Vincent and the GrenadinesSudanSwedenSwitzerlandSyriaTaiwanThailandTrinidad and TobagoTurkeyUgandaUkraineUruguayUzbekistanVenezuelaVietnamWest IndiesWestern AfricaWestern AsiaWestern EuropeYemenZaireZimbabweAzores
Immigrants from Iraq
Race
Ancestry
AfghanAfricanAlaska NativeAlaskan AthabascanAlbanianAleutAlsatianAmericanApacheArabArapahoArgentineanArmenianAssyrian/Chaldean/SyriacAustralianAustrianBahamianBangladeshiBarbadianBasqueBelgianBelizeanBermudanBhutaneseBlackfeetBolivianBrazilianBritishBritish West IndianBulgarianBurmeseCajunCambodianCanadianCape VerdeanCarpatho RusynCelticCentral AmericanCentral American IndianCherokeeCheyenneChickasawChileanChineseChippewaChoctawColombianColvilleComancheCosta RicanCreeCreekCroatianCubanCypriotCzechCzechoslovakianDanishDelawareDominicanDutchDutch West IndianEastern EuropeanEcuadorianEgyptianEnglishEstonianEthiopianEuropeanFijianFilipinoFinnishFrenchFrench American IndianFrench CanadianGermanGerman RussianGhanaianGreekGuamanian/ChamorroGuatemalanGuyaneseHaitianHmongHonduranHopiHoumaHungarianIcelanderIndian (Asian)IndonesianInupiatIranianIraqiIrishIroquoisIsraeliItalianJamaicanJapaneseJordanianKenyanKiowaKoreanLaotianLatvianLebaneseLiberianLithuanianLumbeeLuxembourgerMacedonianMalaysianMalteseMarshalleseMenomineeMexicanMexican American IndianMongolianMoroccanNative HawaiianNavajoNepaleseNew ZealanderNicaraguanNigerianNorthern EuropeanNorwegianOkinawanOsageOttawaPaiutePakistaniPalestinianPanamanianParaguayanPennsylvania GermanPeruvianPimaPolishPortuguesePotawatomiPuebloPuerto RicanPuget Sound SalishRomanianRussianSalvadoranSamoanScandinavianScotch-IrishScottishSeminoleSenegaleseSerbianShoshoneSierra LeoneanSiouxSlavicSlovakSloveneSomaliSouth AfricanSouth AmericanSouth American IndianSoviet UnionSpaniardSpanishSpanish AmericanSpanish American IndianSri LankanSubsaharan AfricanSudaneseSwedishSwissSyrianTaiwaneseThaiTlingit-HaidaTohono O'OdhamTonganTrinidadian and TobagonianTsimshianTurkishU.S. Virgin IslanderUgandanUkrainianUruguayanUteVenezuelanVietnameseWelshWest IndianYakamaYaquiYugoslavianYumanYup'ikZimbabwean
Immigration
NonimmigrantsImmigrantsAfghanistanAfricaAlbaniaArgentinaArmeniaAsiaAustraliaAustriaBahamasBangladeshBarbadosBelarusBelgiumBelizeBoliviaBosnia and HerzegovinaBrazilBulgariaBurma/MyanmarCabo VerdeCambodiaCameroonCanadaCaribbeanCentral AmericaChileChinaColombiaCongoCosta RicaCroatiaCubaCzechoslovakiaDenmarkDominicaDominican RepublicEastern AfricaEastern AsiaEastern EuropeEcuadorEgyptEl SalvadorEnglandEritreaEthiopiaEuropeFijiFranceGermanyGhanaGreeceGrenadaGuatemalaGuyanaHaitiHondurasHong KongHungaryIndiaIndonesiaIranIraqIrelandIsraelItalyJamaicaJapanJordanKazakhstanKenyaKoreaKuwaitLaosLatin AmericaLatviaLebanonLiberiaLithuaniaMalaysiaMexicoMicronesiaMiddle AfricaMoldovaMoroccoNepalNetherlandsNicaraguaNigeriaNorth AmericaNorth MacedoniaNorthern AfricaNorthern EuropeNorwayOceaniaPakistanPanamaPeruPhilippinesPolandPortugalRomaniaRussiaSaudi ArabiaScotlandSenegalSerbiaSierra LeoneSingaporeSomaliaSouth AfricaSouth AmericaSouth Central AsiaSouth Eastern AsiaSouthern EuropeSpainSri LankaSt. Vincent and the GrenadinesSudanSwedenSwitzerlandSyriaTaiwanThailandTrinidad and TobagoTurkeyUgandaUkraineUruguayUzbekistanVenezuelaVietnamWest IndiesWestern AfricaWestern AsiaWestern EuropeYemenZaireZimbabweAzores
3rd Grade
Income
Poverty
Unemployment
Labor Participation
Family Structure
Vehicle Availability
Education Level
Disability

3rd Grade Comparison

Crow

Immigrants from Iraq

Exceptional
Tragic
99.6%
3RD GRADE
100.0/ 100
METRIC RATING
1st/ 347
METRIC RANK
97.4%
3RD GRADE
1.8/ 100
METRIC RATING
235th/ 347
METRIC RANK

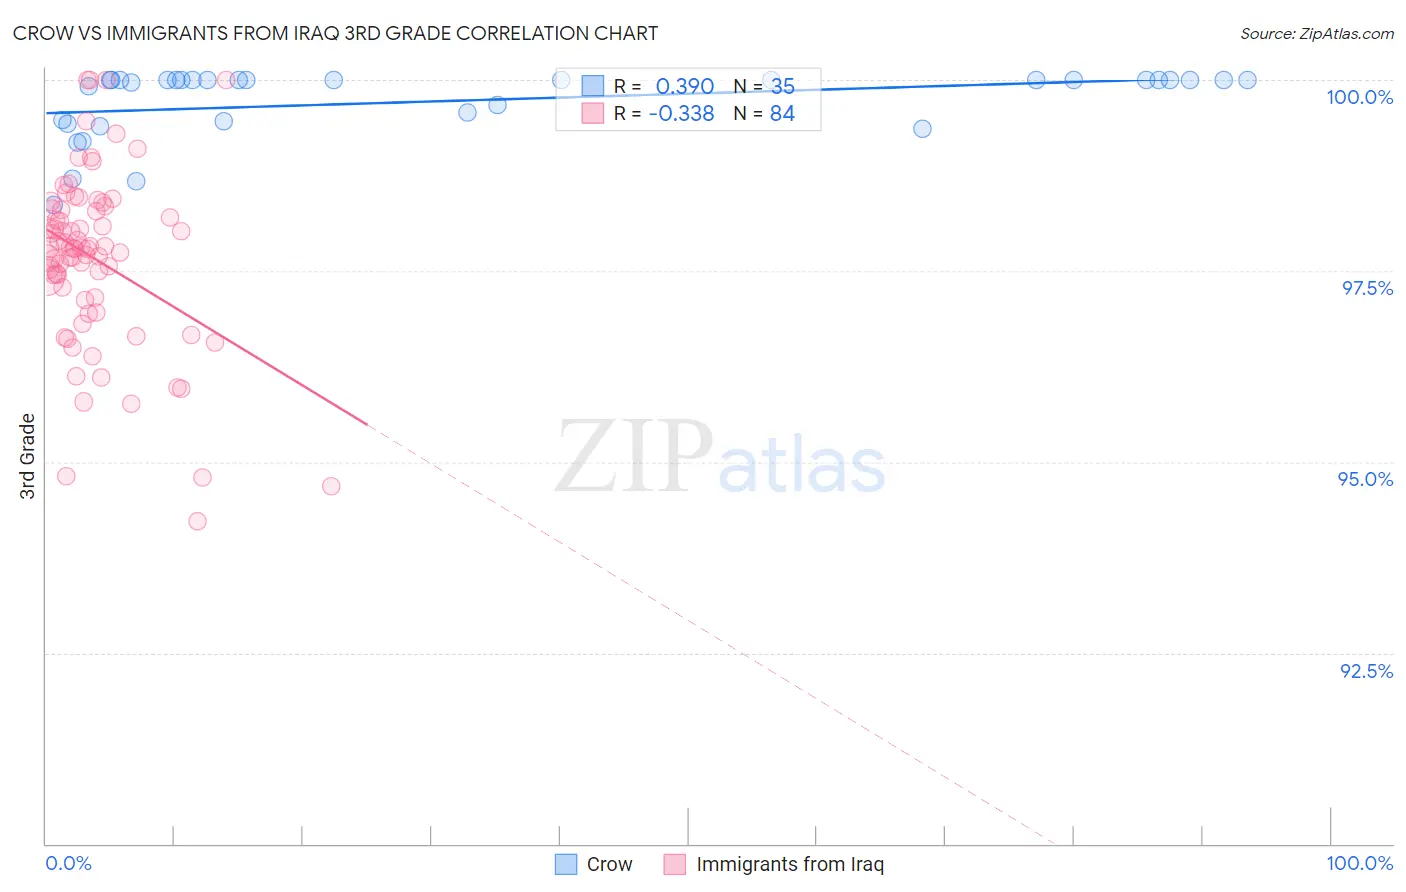
Crow vs Immigrants from Iraq 3rd Grade Correlation Chart

The statistical analysis conducted on geographies consisting of 665,246 people shows a mild positive correlation between the proportion of Crow and percentage of population with at least 3rd grade education in the United States with a correlation coefficient (R) of 0.390 and weighted average of 99.6%. Similarly, the statistical analysis conducted on geographies consisting of 194,726,982 people shows a mild negative correlation between the proportion of Immigrants from Iraq and percentage of population with at least 3rd grade education in the United States with a correlation coefficient (R) of -0.338 and weighted average of 97.4%, a difference of 2.2%.
Crow vs Immigrants from Iraq 3rd Grade

3rd Grade Correlation Summary

MeasurementCrowImmigrants from Iraq
Minimum98.4%94.2%
Maximum100.0%100.0%
Range1.6%5.8%
Mean99.7%97.7%
Median100.0%97.8%
Interquartile 25% (IQ1)99.5%97.1%
Interquartile 75% (IQ3)100.0%98.3%
Interquartile Range (IQR)0.53%1.2%
Standard Deviation (Sample)0.44%1.2%
Standard Deviation (Population)0.44%1.1%

Similar Demographics by 3rd Grade

Demographics Similar to Crow by 3rd Grade

In terms of 3rd grade, the demographic groups most similar to Crow are Yup'ik (99.0%, a difference of 0.60%), Welsh (98.8%, a difference of 0.84%), Inupiat (98.8%, a difference of 0.86%), Tsimshian (98.8%, a difference of 0.87%), and Alaskan Athabascan (98.7%, a difference of 0.97%).
DemographicsRating | Rank3rd Grade
Crow
100.0
/100
|
#1
Exceptional
99.6%
Yup'ik
100.0
/100
|
#2
Exceptional
99.0%
Welsh
100.0
/100
|
#3
Exceptional
98.8%
Inupiat
100.0
/100
|
#4
Exceptional
98.8%
Tsimshian
100.0
/100
|
#5
Exceptional
98.8%
Alaskan Athabascans
100.0
/100
|
#6
Exceptional
98.7%
Norwegians
100.0
/100
|
#7
Exceptional
98.6%
Slovaks
100.0
/100
|
#8
Exceptional
98.6%
Germans
100.0
/100
|
#9
Exceptional
98.6%
Alaska Natives
100.0
/100
|
#10
Exceptional
98.6%
Slovenes
100.0
/100
|
#11
Exceptional
98.6%
English
100.0
/100
|
#12
Exceptional
98.6%
Tlingit-Haida
100.0
/100
|
#13
Exceptional
98.5%
Carpatho Rusyns
100.0
/100
|
#14
Exceptional
98.5%
Swedes
100.0
/100
|
#15
Exceptional
98.5%

Demographics Similar to Immigrants from Iraq by 3rd Grade

In terms of 3rd grade, the demographic groups most similar to Immigrants from Iraq are Liberian (97.4%, a difference of 0.0%), Colombian (97.4%, a difference of 0.0%), Immigrants from Eastern Asia (97.4%, a difference of 0.010%), Immigrants from Uruguay (97.4%, a difference of 0.010%), and Nigerian (97.4%, a difference of 0.010%).
DemographicsRating | Rank3rd Grade
Sub-Saharan Africans
3.2
/100
|
#228
Tragic
97.5%
Senegalese
3.0
/100
|
#229
Tragic
97.5%
Immigrants | Pakistan
2.7
/100
|
#230
Tragic
97.5%
Immigrants | Costa Rica
2.7
/100
|
#231
Tragic
97.5%
Immigrants | Western Asia
2.6
/100
|
#232
Tragic
97.5%
Immigrants | Malaysia
2.4
/100
|
#233
Tragic
97.5%
Immigrants | Eastern Asia
1.9
/100
|
#234
Tragic
97.4%
Immigrants | Iraq
1.8
/100
|
#235
Tragic
97.4%
Liberians
1.8
/100
|
#236
Tragic
97.4%
Colombians
1.8
/100
|
#237
Tragic
97.4%
Immigrants | Uruguay
1.7
/100
|
#238
Tragic
97.4%
Nigerians
1.6
/100
|
#239
Tragic
97.4%
U.S. Virgin Islanders
1.4
/100
|
#240
Tragic
97.4%
Immigrants | Indonesia
1.4
/100
|
#241
Tragic
97.4%
Koreans
1.3
/100
|
#242
Tragic
97.4%