Croatian vs Tlingit-Haida Master's Degree
COMPARE
Croatian
Tlingit-Haida
Master's Degree
Master's Degree Comparison
Croatians
Tlingit-Haida
16.4%
MASTER'S DEGREE
95.6/ 100
METRIC RATING
123rd/ 347
METRIC RANK
12.8%
MASTER'S DEGREE
1.3/ 100
METRIC RATING
251st/ 347
METRIC RANK
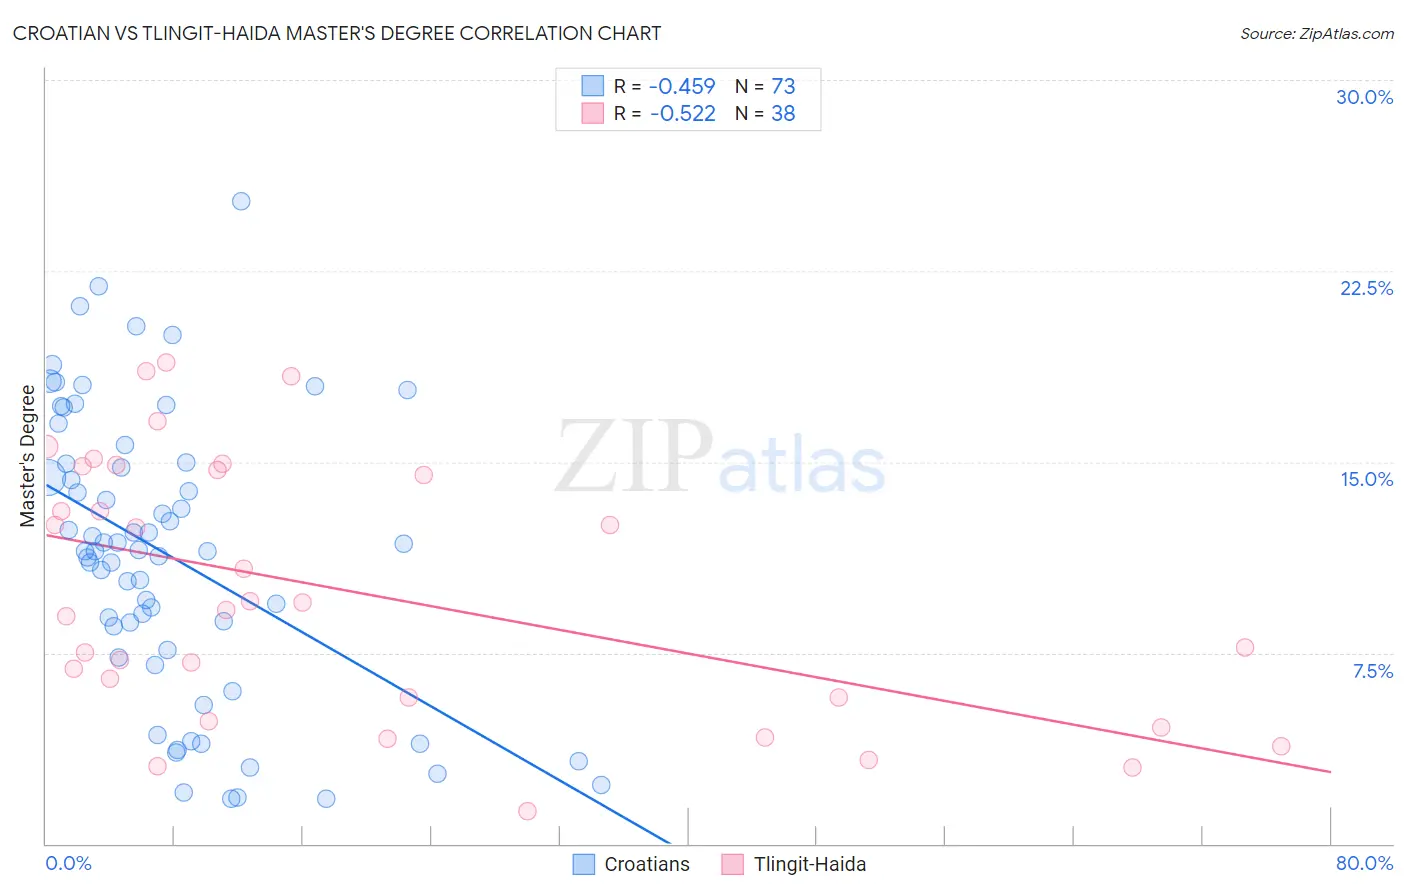
Croatian vs Tlingit-Haida Master's Degree Correlation Chart
The statistical analysis conducted on geographies consisting of 375,633,204 people shows a moderate negative correlation between the proportion of Croatians and percentage of population with at least master's degree education in the United States with a correlation coefficient (R) of -0.459 and weighted average of 16.4%. Similarly, the statistical analysis conducted on geographies consisting of 60,869,548 people shows a substantial negative correlation between the proportion of Tlingit-Haida and percentage of population with at least master's degree education in the United States with a correlation coefficient (R) of -0.522 and weighted average of 12.8%, a difference of 27.6%.
Master's Degree Correlation Summary
| Measurement | Croatian | Tlingit-Haida |
| Minimum | 1.8% | 1.3% |
| Maximum | 25.2% | 18.9% |
| Range | 23.5% | 17.7% |
| Mean | 11.3% | 9.9% |
| Median | 11.5% | 9.3% |
| Interquartile 25% (IQ1) | 7.5% | 5.7% |
| Interquartile 75% (IQ3) | 15.0% | 14.7% |
| Interquartile Range (IQR) | 7.5% | 8.9% |
| Standard Deviation (Sample) | 5.6% | 5.1% |
| Standard Deviation (Population) | 5.5% | 5.0% |
Similar Demographics by Master's Degree
Demographics Similar to Croatians by Master's Degree
In terms of master's degree, the demographic groups most similar to Croatians are British (16.4%, a difference of 0.010%), Immigrants from Eritrea (16.4%, a difference of 0.070%), Italian (16.4%, a difference of 0.14%), Immigrants from Eastern Africa (16.3%, a difference of 0.26%), and Afghan (16.5%, a difference of 0.44%).
| Demographics | Rating | Rank | Master's Degree |
| Immigrants | Southern Europe | 97.2 /100 | #116 | Exceptional 16.6% |
| Immigrants | Moldova | 97.2 /100 | #117 | Exceptional 16.6% |
| Brazilians | 96.8 /100 | #118 | Exceptional 16.5% |
| Jordanians | 96.5 /100 | #119 | Exceptional 16.5% |
| Lebanese | 96.4 /100 | #120 | Exceptional 16.5% |
| Afghans | 96.2 /100 | #121 | Exceptional 16.5% |
| British | 95.6 /100 | #122 | Exceptional 16.4% |
| Croatians | 95.6 /100 | #123 | Exceptional 16.4% |
| Immigrants | Eritrea | 95.5 /100 | #124 | Exceptional 16.4% |
| Italians | 95.4 /100 | #125 | Exceptional 16.4% |
| Immigrants | Eastern Africa | 95.2 /100 | #126 | Exceptional 16.3% |
| Palestinians | 94.8 /100 | #127 | Exceptional 16.3% |
| Immigrants | Sierra Leone | 94.7 /100 | #128 | Exceptional 16.3% |
| Immigrants | Syria | 93.3 /100 | #129 | Exceptional 16.2% |
| Immigrants | Jordan | 92.7 /100 | #130 | Exceptional 16.1% |
Demographics Similar to Tlingit-Haida by Master's Degree
In terms of master's degree, the demographic groups most similar to Tlingit-Haida are Liberian (12.8%, a difference of 0.030%), Cree (12.8%, a difference of 0.040%), African (12.9%, a difference of 0.35%), Iroquois (12.9%, a difference of 0.43%), and Immigrants from Cambodia (12.9%, a difference of 0.47%).
| Demographics | Rating | Rank | Master's Degree |
| Delaware | 1.7 /100 | #244 | Tragic 13.0% |
| Immigrants | Bahamas | 1.4 /100 | #245 | Tragic 12.9% |
| Immigrants | Cambodia | 1.4 /100 | #246 | Tragic 12.9% |
| Iroquois | 1.4 /100 | #247 | Tragic 12.9% |
| Africans | 1.4 /100 | #248 | Tragic 12.9% |
| Cree | 1.3 /100 | #249 | Tragic 12.8% |
| Liberians | 1.3 /100 | #250 | Tragic 12.8% |
| Tlingit-Haida | 1.3 /100 | #251 | Tragic 12.8% |
| French American Indians | 1.0 /100 | #252 | Tragic 12.7% |
| Immigrants | Dominica | 0.8 /100 | #253 | Tragic 12.6% |
| Indonesians | 0.8 /100 | #254 | Tragic 12.6% |
| Immigrants | Congo | 0.8 /100 | #255 | Tragic 12.6% |
| Immigrants | Portugal | 0.8 /100 | #256 | Tragic 12.6% |
| Osage | 0.7 /100 | #257 | Tragic 12.6% |
| Immigrants | Liberia | 0.6 /100 | #258 | Tragic 12.5% |