Croatian vs Immigrants from Colombia 9th Grade

COMPARE

Croatian
Race
Ancestry
AfghanAfricanAlaska NativeAlaskan AthabascanAlbanianAleutAlsatianAmericanApacheArabArapahoArgentineanArmenianAssyrian/Chaldean/SyriacAustralianAustrianBahamianBangladeshiBarbadianBasqueBelgianBelizeanBermudanBhutaneseBlackfeetBolivianBrazilianBritishBritish West IndianBulgarianBurmeseCajunCambodianCanadianCape VerdeanCarpatho RusynCelticCentral AmericanCentral American IndianCherokeeCheyenneChickasawChileanChineseChippewaChoctawColombianColvilleComancheCosta RicanCreeCreekCroatianCrowCubanCypriotCzechCzechoslovakianDanishDelawareDominicanDutchDutch West IndianEastern EuropeanEcuadorianEgyptianEnglishEstonianEthiopianEuropeanFijianFilipinoFinnishFrenchFrench American IndianFrench CanadianGermanGerman RussianGhanaianGreekGuamanian/ChamorroGuatemalanGuyaneseHaitianHmongHonduranHopiHoumaHungarianIcelanderIndian (Asian)IndonesianInupiatIranianIraqiIrishIroquoisIsraeliItalianJamaicanJapaneseJordanianKenyanKiowaKoreanLaotianLatvianLebaneseLiberianLithuanianLumbeeLuxembourgerMacedonianMalaysianMalteseMarshalleseMenomineeMexicanMexican American IndianMongolianMoroccanNative HawaiianNavajoNepaleseNew ZealanderNicaraguanNigerianNorthern EuropeanNorwegianOkinawanOsageOttawaPaiutePakistaniPalestinianPanamanianParaguayanPennsylvania GermanPeruvianPimaPolishPortuguesePotawatomiPuebloPuerto RicanPuget Sound SalishRomanianRussianSalvadoranSamoanScandinavianScotch-IrishScottishSeminoleSenegaleseSerbianShoshoneSierra LeoneanSiouxSlavicSlovakSloveneSomaliSouth AfricanSouth AmericanSouth American IndianSoviet UnionSpaniardSpanishSpanish AmericanSpanish American IndianSri LankanSubsaharan AfricanSudaneseSwedishSwissSyrianTaiwaneseThaiTlingit-HaidaTohono O'OdhamTonganTrinidadian and TobagonianTsimshianTurkishU.S. Virgin IslanderUgandanUkrainianUruguayanUteVenezuelanVietnameseWelshWest IndianYakamaYaquiYugoslavianYumanYup'ikZimbabwean
Immigration
NonimmigrantsImmigrantsAfghanistanAfricaAlbaniaArgentinaArmeniaAsiaAustraliaAustriaBahamasBangladeshBarbadosBelarusBelgiumBelizeBoliviaBosnia and HerzegovinaBrazilBulgariaBurma/MyanmarCabo VerdeCambodiaCameroonCanadaCaribbeanCentral AmericaChileChinaCongoCosta RicaCroatiaCubaCzechoslovakiaDenmarkDominicaDominican RepublicEastern AfricaEastern AsiaEastern EuropeEcuadorEgyptEl SalvadorEnglandEritreaEthiopiaEuropeFijiFranceGermanyGhanaGreeceGrenadaGuatemalaGuyanaHaitiHondurasHong KongHungaryIndiaIndonesiaIranIraqIrelandIsraelItalyJamaicaJapanJordanKazakhstanKenyaKoreaKuwaitLaosLatin AmericaLatviaLebanonLiberiaLithuaniaMalaysiaMexicoMicronesiaMiddle AfricaMoldovaMoroccoNepalNetherlandsNicaraguaNigeriaNorth AmericaNorth MacedoniaNorthern AfricaNorthern EuropeNorwayOceaniaPakistanPanamaPeruPhilippinesPolandPortugalRomaniaRussiaSaudi ArabiaScotlandSenegalSerbiaSierra LeoneSingaporeSomaliaSouth AfricaSouth AmericaSouth Central AsiaSouth Eastern AsiaSouthern EuropeSpainSri LankaSt. Vincent and the GrenadinesSudanSwedenSwitzerlandSyriaTaiwanThailandTrinidad and TobagoTurkeyUgandaUkraineUruguayUzbekistanVenezuelaVietnamWest IndiesWestern AfricaWestern AsiaWestern EuropeYemenZaireZimbabweAzores
Immigrants from Colombia
Race
Ancestry
AfghanAfricanAlaska NativeAlaskan AthabascanAlbanianAleutAlsatianAmericanApacheArabArapahoArgentineanArmenianAssyrian/Chaldean/SyriacAustralianAustrianBahamianBangladeshiBarbadianBasqueBelgianBelizeanBermudanBhutaneseBlackfeetBolivianBrazilianBritishBritish West IndianBulgarianBurmeseCajunCambodianCanadianCape VerdeanCarpatho RusynCelticCentral AmericanCentral American IndianCherokeeCheyenneChickasawChileanChineseChippewaChoctawColombianColvilleComancheCosta RicanCreeCreekCrowCubanCypriotCzechCzechoslovakianDanishDelawareDominicanDutchDutch West IndianEastern EuropeanEcuadorianEgyptianEnglishEstonianEthiopianEuropeanFijianFilipinoFinnishFrenchFrench American IndianFrench CanadianGermanGerman RussianGhanaianGreekGuamanian/ChamorroGuatemalanGuyaneseHaitianHmongHonduranHopiHoumaHungarianIcelanderIndian (Asian)IndonesianInupiatIranianIraqiIrishIroquoisIsraeliItalianJamaicanJapaneseJordanianKenyanKiowaKoreanLaotianLatvianLebaneseLiberianLithuanianLumbeeLuxembourgerMacedonianMalaysianMalteseMarshalleseMenomineeMexicanMexican American IndianMongolianMoroccanNative HawaiianNavajoNepaleseNew ZealanderNicaraguanNigerianNorthern EuropeanNorwegianOkinawanOsageOttawaPaiutePakistaniPalestinianPanamanianParaguayanPennsylvania GermanPeruvianPimaPolishPortuguesePotawatomiPuebloPuerto RicanPuget Sound SalishRomanianRussianSalvadoranSamoanScandinavianScotch-IrishScottishSeminoleSenegaleseSerbianShoshoneSierra LeoneanSiouxSlavicSlovakSloveneSomaliSouth AfricanSouth AmericanSouth American IndianSoviet UnionSpaniardSpanishSpanish AmericanSpanish American IndianSri LankanSubsaharan AfricanSudaneseSwedishSwissSyrianTaiwaneseThaiTlingit-HaidaTohono O'OdhamTonganTrinidadian and TobagonianTsimshianTurkishU.S. Virgin IslanderUgandanUkrainianUruguayanUteVenezuelanVietnameseWelshWest IndianYakamaYaquiYugoslavianYumanYup'ikZimbabwean
Immigration
NonimmigrantsImmigrantsAfghanistanAfricaAlbaniaArgentinaArmeniaAsiaAustraliaAustriaBahamasBangladeshBarbadosBelarusBelgiumBelizeBoliviaBosnia and HerzegovinaBrazilBulgariaBurma/MyanmarCabo VerdeCambodiaCameroonCanadaCaribbeanCentral AmericaChileChinaColombiaCongoCosta RicaCroatiaCubaCzechoslovakiaDenmarkDominicaDominican RepublicEastern AfricaEastern AsiaEastern EuropeEcuadorEgyptEl SalvadorEnglandEritreaEthiopiaEuropeFijiFranceGermanyGhanaGreeceGrenadaGuatemalaGuyanaHaitiHondurasHong KongHungaryIndiaIndonesiaIranIraqIrelandIsraelItalyJamaicaJapanJordanKazakhstanKenyaKoreaKuwaitLaosLatin AmericaLatviaLebanonLiberiaLithuaniaMalaysiaMexicoMicronesiaMiddle AfricaMoldovaMoroccoNepalNetherlandsNicaraguaNigeriaNorth AmericaNorth MacedoniaNorthern AfricaNorthern EuropeNorwayOceaniaPakistanPanamaPeruPhilippinesPolandPortugalRomaniaRussiaSaudi ArabiaScotlandSenegalSerbiaSierra LeoneSingaporeSomaliaSouth AfricaSouth AmericaSouth Central AsiaSouth Eastern AsiaSouthern EuropeSpainSri LankaSt. Vincent and the GrenadinesSudanSwedenSwitzerlandSyriaTaiwanThailandTrinidad and TobagoTurkeyUgandaUkraineUruguayUzbekistanVenezuelaVietnamWest IndiesWestern AfricaWestern AsiaWestern EuropeYemenZaireZimbabweAzores
9th Grade
Income
Poverty
Unemployment
Labor Participation
Family Structure
Vehicle Availability
Education Level
Disability

9th Grade Comparison

Croatians

Immigrants from Colombia

Exceptional
Tragic
96.5%
9TH GRADE
100.0/ 100
METRIC RATING
16th/ 347
METRIC RANK
93.8%
9TH GRADE
0.2/ 100
METRIC RATING
275th/ 347
METRIC RANK

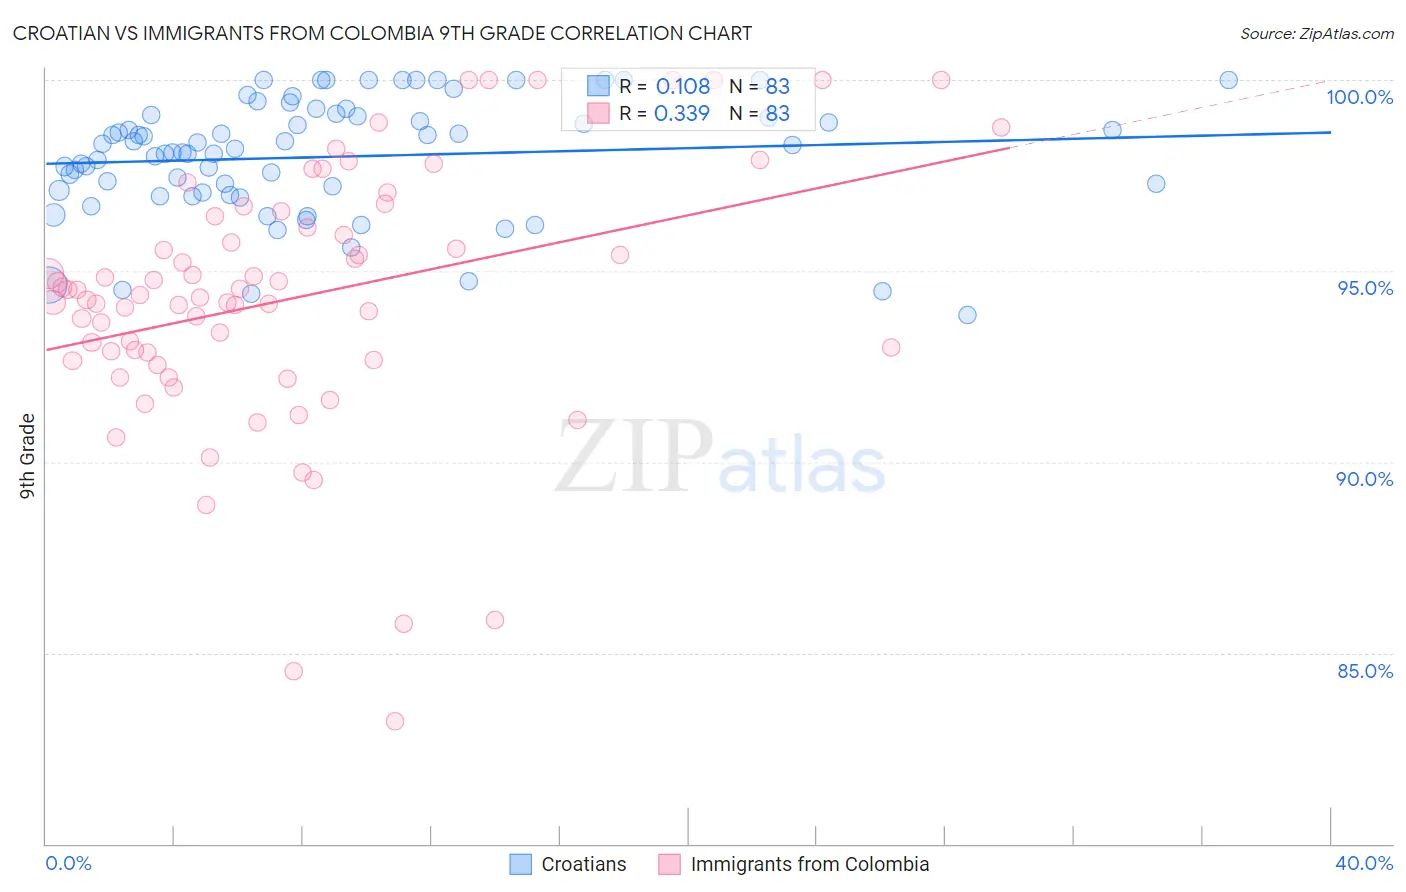
Croatian vs Immigrants from Colombia 9th Grade Correlation Chart

The statistical analysis conducted on geographies consisting of 375,734,264 people shows a poor positive correlation between the proportion of Croatians and percentage of population with at least 9th grade education in the United States with a correlation coefficient (R) of 0.108 and weighted average of 96.5%. Similarly, the statistical analysis conducted on geographies consisting of 378,643,826 people shows a mild positive correlation between the proportion of Immigrants from Colombia and percentage of population with at least 9th grade education in the United States with a correlation coefficient (R) of 0.339 and weighted average of 93.8%, a difference of 2.9%.
Croatian vs Immigrants from Colombia 9th Grade

9th Grade Correlation Summary

MeasurementCroatianImmigrants from Colombia
Minimum93.9%83.2%
Maximum100.0%100.0%
Range6.1%16.8%
Mean98.0%94.3%
Median98.2%94.4%
Interquartile 25% (IQ1)97.1%92.7%
Interquartile 75% (IQ3)99.1%96.4%
Interquartile Range (IQR)2.0%3.7%
Standard Deviation (Sample)1.5%3.4%
Standard Deviation (Population)1.5%3.4%

Similar Demographics by 9th Grade

Demographics Similar to Croatians by 9th Grade

In terms of 9th grade, the demographic groups most similar to Croatians are Scottish (96.5%, a difference of 0.0%), Irish (96.5%, a difference of 0.0%), Danish (96.5%, a difference of 0.010%), English (96.6%, a difference of 0.050%), and Dutch (96.5%, a difference of 0.060%).
DemographicsRating | Rank9th Grade
Tlingit-Haida
100.0
/100
|
#9
Exceptional
96.6%
Lithuanians
100.0
/100
|
#10
Exceptional
96.6%
Finns
100.0
/100
|
#11
Exceptional
96.6%
English
100.0
/100
|
#12
Exceptional
96.6%
Danes
100.0
/100
|
#13
Exceptional
96.5%
Scottish
100.0
/100
|
#14
Exceptional
96.5%
Irish
100.0
/100
|
#15
Exceptional
96.5%
Croatians
100.0
/100
|
#16
Exceptional
96.5%
Dutch
100.0
/100
|
#17
Exceptional
96.5%
Scandinavians
100.0
/100
|
#18
Exceptional
96.5%
Welsh
100.0
/100
|
#19
Exceptional
96.4%
Italians
100.0
/100
|
#20
Exceptional
96.4%
Alaskan Athabascans
100.0
/100
|
#21
Exceptional
96.4%
Europeans
100.0
/100
|
#22
Exceptional
96.4%
Czechs
100.0
/100
|
#23
Exceptional
96.4%

Demographics Similar to Immigrants from Colombia by 9th Grade

In terms of 9th grade, the demographic groups most similar to Immigrants from Colombia are Immigrants from South America (93.8%, a difference of 0.010%), Peruvian (93.8%, a difference of 0.010%), Immigrants from Western Africa (93.8%, a difference of 0.020%), West Indian (93.7%, a difference of 0.020%), and Immigrants from Philippines (93.7%, a difference of 0.020%).
DemographicsRating | Rank9th Grade
Immigrants | Bolivia
0.3
/100
|
#268
Tragic
93.9%
Immigrants | Uruguay
0.2
/100
|
#269
Tragic
93.8%
Yuman
0.2
/100
|
#270
Tragic
93.8%
Immigrants | Ghana
0.2
/100
|
#271
Tragic
93.8%
Immigrants | Western Africa
0.2
/100
|
#272
Tragic
93.8%
Immigrants | South America
0.2
/100
|
#273
Tragic
93.8%
Peruvians
0.2
/100
|
#274
Tragic
93.8%
Immigrants | Colombia
0.2
/100
|
#275
Tragic
93.8%
West Indians
0.2
/100
|
#276
Tragic
93.7%
Immigrants | Philippines
0.1
/100
|
#277
Tragic
93.7%
Immigrants | Eritrea
0.1
/100
|
#278
Tragic
93.7%
Trinidadians and Tobagonians
0.1
/100
|
#279
Tragic
93.7%
Taiwanese
0.1
/100
|
#280
Tragic
93.6%
Immigrants | Trinidad and Tobago
0.1
/100
|
#281
Tragic
93.6%
Malaysians
0.0
/100
|
#282
Tragic
93.5%