Croatian vs Cajun High School Diploma
COMPARE
Croatian
Cajun
High School Diploma
High School Diploma Comparison
Croatians
Cajuns
92.0%
HIGH SCHOOL DIPLOMA
100.0/ 100
METRIC RATING
10th/ 347
METRIC RANK
87.3%
HIGH SCHOOL DIPLOMA
0.4/ 100
METRIC RATING
260th/ 347
METRIC RANK
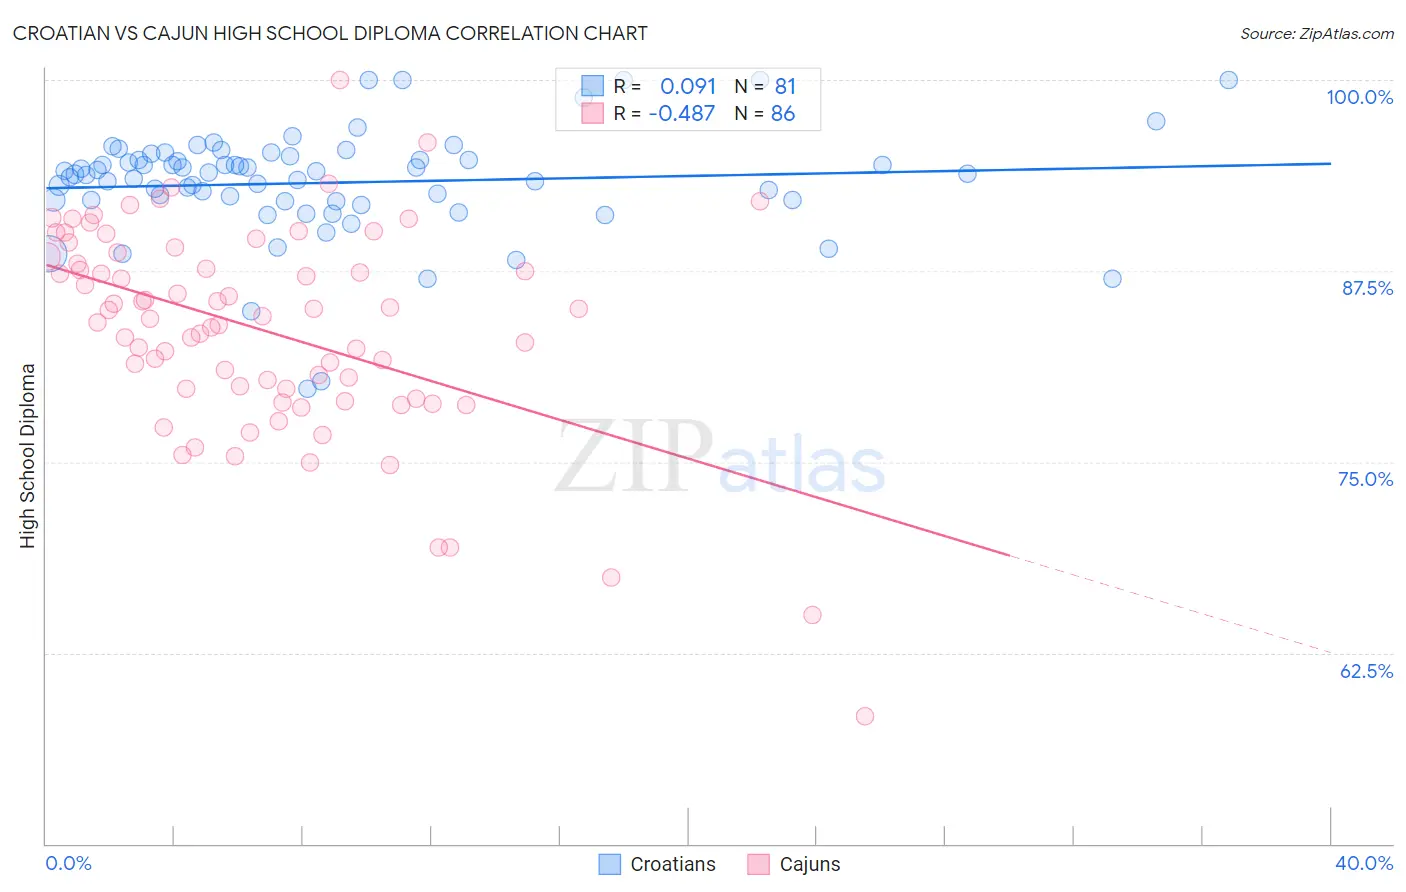
Croatian vs Cajun High School Diploma Correlation Chart
The statistical analysis conducted on geographies consisting of 375,733,787 people shows a slight positive correlation between the proportion of Croatians and percentage of population with at least high school diploma education in the United States with a correlation coefficient (R) of 0.091 and weighted average of 92.0%. Similarly, the statistical analysis conducted on geographies consisting of 149,713,149 people shows a moderate negative correlation between the proportion of Cajuns and percentage of population with at least high school diploma education in the United States with a correlation coefficient (R) of -0.487 and weighted average of 87.3%, a difference of 5.3%.
High School Diploma Correlation Summary
| Measurement | Croatian | Cajun |
| Minimum | 79.8% | 58.4% |
| Maximum | 100.0% | 100.0% |
| Range | 20.2% | 41.6% |
| Mean | 93.3% | 83.6% |
| Median | 93.9% | 84.5% |
| Interquartile 25% (IQ1) | 92.1% | 79.8% |
| Interquartile 75% (IQ3) | 94.9% | 88.4% |
| Interquartile Range (IQR) | 2.8% | 8.7% |
| Standard Deviation (Sample) | 3.6% | 6.9% |
| Standard Deviation (Population) | 3.6% | 6.8% |
Similar Demographics by High School Diploma
Demographics Similar to Croatians by High School Diploma
In terms of high school diploma, the demographic groups most similar to Croatians are Latvian (92.0%, a difference of 0.030%), Chinese (92.0%, a difference of 0.050%), Slovak (92.0%, a difference of 0.060%), Immigrants from India (92.0%, a difference of 0.060%), and Eastern European (91.9%, a difference of 0.070%).
| Demographics | Rating | Rank | High School Diploma |
| Carpatho Rusyns | 100.0 /100 | #3 | Exceptional 92.1% |
| Lithuanians | 100.0 /100 | #4 | Exceptional 92.0% |
| Slovenes | 100.0 /100 | #5 | Exceptional 92.0% |
| Slovaks | 100.0 /100 | #6 | Exceptional 92.0% |
| Immigrants | India | 100.0 /100 | #7 | Exceptional 92.0% |
| Chinese | 100.0 /100 | #8 | Exceptional 92.0% |
| Latvians | 100.0 /100 | #9 | Exceptional 92.0% |
| Croatians | 100.0 /100 | #10 | Exceptional 92.0% |
| Eastern Europeans | 100.0 /100 | #11 | Exceptional 91.9% |
| Poles | 100.0 /100 | #12 | Exceptional 91.9% |
| Danes | 100.0 /100 | #13 | Exceptional 91.8% |
| Bulgarians | 100.0 /100 | #14 | Exceptional 91.8% |
| Luxembourgers | 100.0 /100 | #15 | Exceptional 91.7% |
| Finns | 100.0 /100 | #16 | Exceptional 91.7% |
| Immigrants | Singapore | 99.9 /100 | #17 | Exceptional 91.7% |
Demographics Similar to Cajuns by High School Diploma
In terms of high school diploma, the demographic groups most similar to Cajuns are Seminole (87.3%, a difference of 0.020%), Immigrants from Peru (87.3%, a difference of 0.050%), Immigrants from Ghana (87.4%, a difference of 0.080%), Immigrants from Western Africa (87.4%, a difference of 0.080%), and Immigrants from South Eastern Asia (87.2%, a difference of 0.080%).
| Demographics | Rating | Rank | High School Diploma |
| Immigrants | Uruguay | 1.0 /100 | #253 | Tragic 87.6% |
| Immigrants | Colombia | 1.0 /100 | #254 | Tragic 87.6% |
| Immigrants | Senegal | 0.9 /100 | #255 | Tragic 87.6% |
| Africans | 0.7 /100 | #256 | Tragic 87.5% |
| Bahamians | 0.7 /100 | #257 | Tragic 87.5% |
| Immigrants | Ghana | 0.5 /100 | #258 | Tragic 87.4% |
| Immigrants | Western Africa | 0.5 /100 | #259 | Tragic 87.4% |
| Cajuns | 0.4 /100 | #260 | Tragic 87.3% |
| Seminole | 0.4 /100 | #261 | Tragic 87.3% |
| Immigrants | Peru | 0.4 /100 | #262 | Tragic 87.3% |
| Immigrants | South Eastern Asia | 0.3 /100 | #263 | Tragic 87.2% |
| Jamaicans | 0.3 /100 | #264 | Tragic 87.2% |
| U.S. Virgin Islanders | 0.2 /100 | #265 | Tragic 87.1% |
| Immigrants | Congo | 0.2 /100 | #266 | Tragic 87.0% |
| Blacks/African Americans | 0.2 /100 | #267 | Tragic 87.0% |