Creek vs Osage 12th Grade, No Diploma
COMPARE
Creek
Osage
12th Grade, No Diploma
12th Grade, No Diploma Comparison
Creek
Osage
90.3%
12TH GRADE, NO DIPLOMA
3.9/ 100
METRIC RATING
228th/ 347
METRIC RANK
91.0%
12TH GRADE, NO DIPLOMA
38.3/ 100
METRIC RATING
183rd/ 347
METRIC RANK
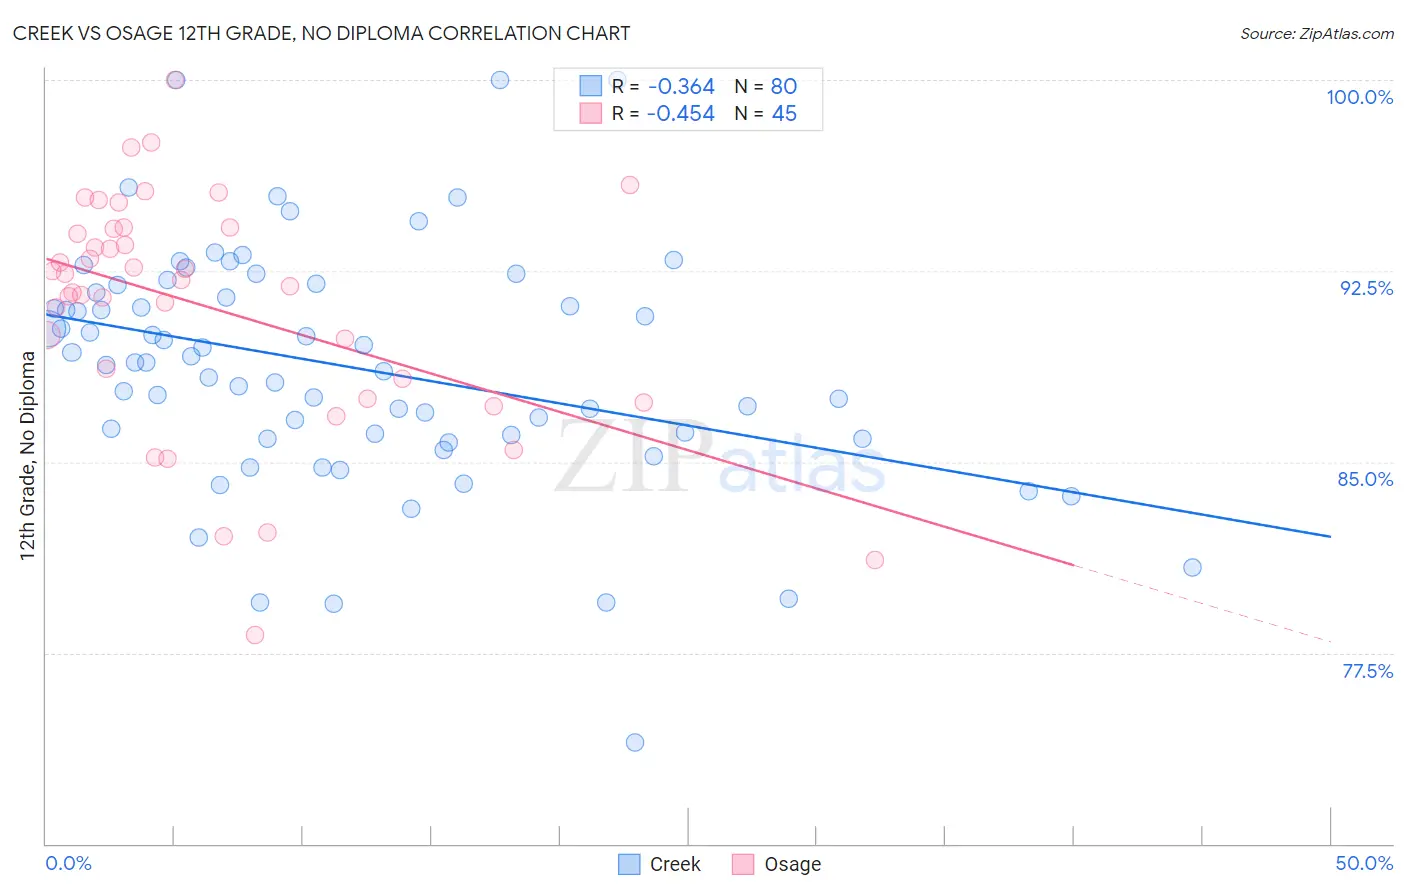
Creek vs Osage 12th Grade, No Diploma Correlation Chart
The statistical analysis conducted on geographies consisting of 178,480,629 people shows a mild negative correlation between the proportion of Creek and percentage of population with at least 12th grade (no diploma) education in the United States with a correlation coefficient (R) of -0.364 and weighted average of 90.3%. Similarly, the statistical analysis conducted on geographies consisting of 91,808,929 people shows a moderate negative correlation between the proportion of Osage and percentage of population with at least 12th grade (no diploma) education in the United States with a correlation coefficient (R) of -0.454 and weighted average of 91.0%, a difference of 0.85%.
12th Grade, No Diploma Correlation Summary
| Measurement | Creek | Osage |
| Minimum | 74.0% | 78.2% |
| Maximum | 100.0% | 100.0% |
| Range | 26.0% | 21.8% |
| Mean | 88.7% | 91.1% |
| Median | 88.9% | 92.1% |
| Interquartile 25% (IQ1) | 86.0% | 87.9% |
| Interquartile 75% (IQ3) | 91.8% | 94.2% |
| Interquartile Range (IQR) | 5.8% | 6.3% |
| Standard Deviation (Sample) | 4.7% | 4.7% |
| Standard Deviation (Population) | 4.7% | 4.6% |
Similar Demographics by 12th Grade, No Diploma
Demographics Similar to Creek by 12th Grade, No Diploma
In terms of 12th grade, no diploma, the demographic groups most similar to Creek are Immigrants from Bahamas (90.2%, a difference of 0.020%), Immigrants from Zaire (90.3%, a difference of 0.050%), Nigerian (90.3%, a difference of 0.050%), Immigrants from Panama (90.3%, a difference of 0.070%), and Chickasaw (90.3%, a difference of 0.070%).
| Demographics | Rating | Rank | 12th Grade, No Diploma |
| Immigrants | Liberia | 5.7 /100 | #221 | Tragic 90.4% |
| Immigrants | Somalia | 5.3 /100 | #222 | Tragic 90.4% |
| South Americans | 5.0 /100 | #223 | Tragic 90.3% |
| Immigrants | Panama | 4.8 /100 | #224 | Tragic 90.3% |
| Chickasaw | 4.8 /100 | #225 | Tragic 90.3% |
| Immigrants | Zaire | 4.6 /100 | #226 | Tragic 90.3% |
| Nigerians | 4.5 /100 | #227 | Tragic 90.3% |
| Creek | 3.9 /100 | #228 | Tragic 90.3% |
| Immigrants | Bahamas | 3.6 /100 | #229 | Tragic 90.2% |
| Immigrants | Philippines | 2.8 /100 | #230 | Tragic 90.2% |
| Peruvians | 2.7 /100 | #231 | Tragic 90.2% |
| Blackfeet | 2.4 /100 | #232 | Tragic 90.1% |
| Immigrants | Thailand | 2.3 /100 | #233 | Tragic 90.1% |
| Immigrants | South America | 2.3 /100 | #234 | Tragic 90.1% |
| Colville | 2.3 /100 | #235 | Tragic 90.1% |
Demographics Similar to Osage by 12th Grade, No Diploma
In terms of 12th grade, no diploma, the demographic groups most similar to Osage are Nonimmigrants (91.0%, a difference of 0.010%), Immigrants from Syria (91.1%, a difference of 0.020%), Guamanian/Chamorro (91.0%, a difference of 0.020%), Spaniard (91.0%, a difference of 0.030%), and Sudanese (91.0%, a difference of 0.050%).
| Demographics | Rating | Rank | 12th Grade, No Diploma |
| Iroquois | 48.5 /100 | #176 | Average 91.1% |
| Sierra Leoneans | 47.7 /100 | #177 | Average 91.1% |
| Spanish | 43.7 /100 | #178 | Average 91.1% |
| Immigrants | Chile | 43.3 /100 | #179 | Average 91.1% |
| Immigrants | Syria | 40.3 /100 | #180 | Average 91.1% |
| Guamanians/Chamorros | 39.5 /100 | #181 | Fair 91.0% |
| Immigrants | Nonimmigrants | 38.8 /100 | #182 | Fair 91.0% |
| Osage | 38.3 /100 | #183 | Fair 91.0% |
| Spaniards | 36.2 /100 | #184 | Fair 91.0% |
| Sudanese | 34.4 /100 | #185 | Fair 91.0% |
| Ethiopians | 33.9 /100 | #186 | Fair 91.0% |
| Potawatomi | 32.9 /100 | #187 | Fair 91.0% |
| Americans | 32.6 /100 | #188 | Fair 91.0% |
| Immigrants | Uganda | 31.6 /100 | #189 | Fair 90.9% |
| Afghans | 29.9 /100 | #190 | Fair 90.9% |