Creek vs Mexican Doctorate Degree
COMPARE
Creek
Mexican
Doctorate Degree
Doctorate Degree Comparison
Creek
Mexicans
1.3%
DOCTORATE DEGREE
0.1/ 100
METRIC RATING
318th/ 347
METRIC RANK
1.2%
DOCTORATE DEGREE
0.0/ 100
METRIC RATING
341st/ 347
METRIC RANK
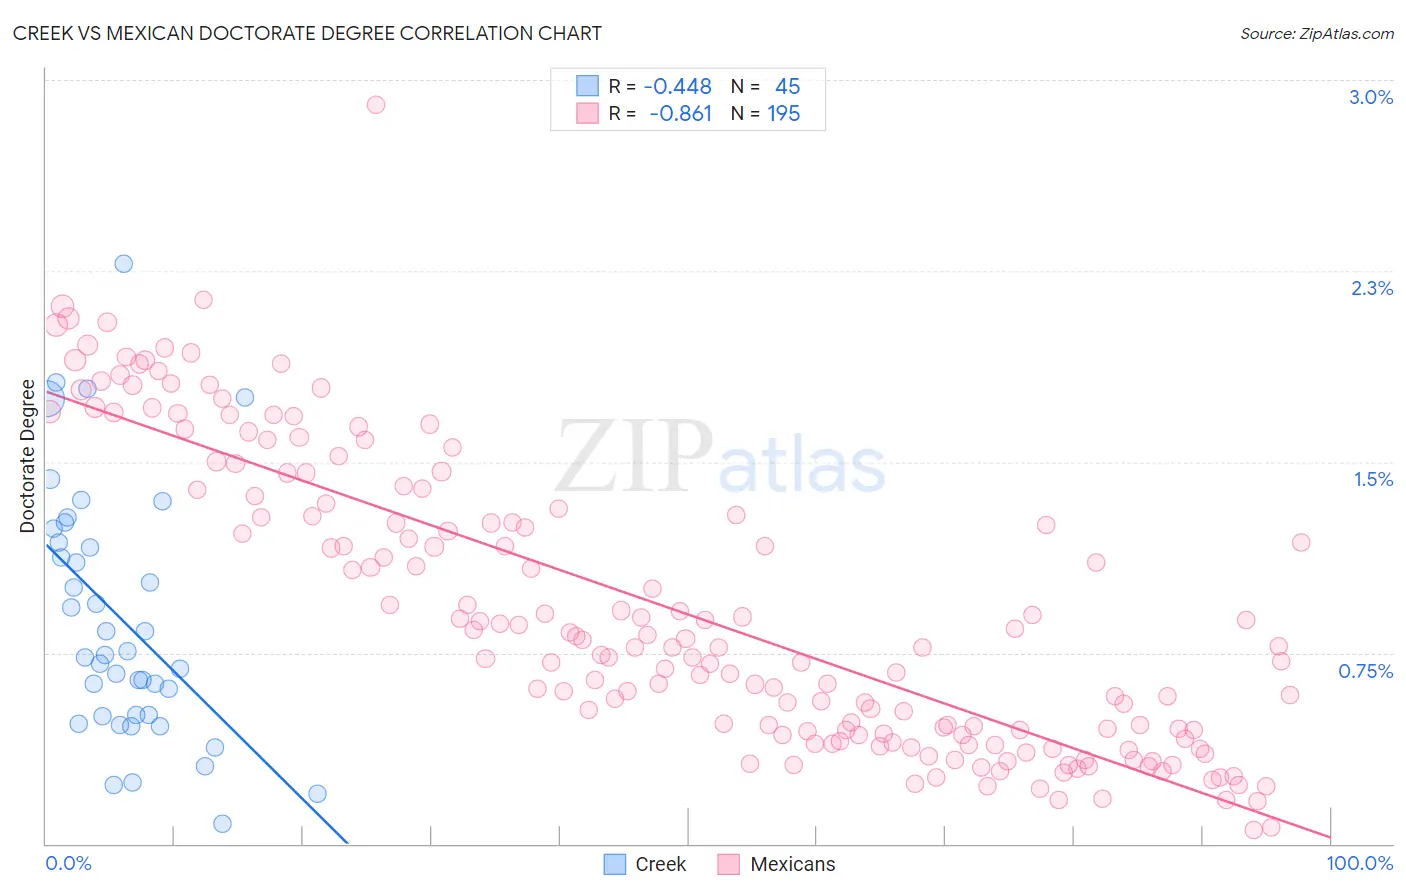
Creek vs Mexican Doctorate Degree Correlation Chart
The statistical analysis conducted on geographies consisting of 176,594,001 people shows a moderate negative correlation between the proportion of Creek and percentage of population with at least doctorate degree education in the United States with a correlation coefficient (R) of -0.448 and weighted average of 1.3%. Similarly, the statistical analysis conducted on geographies consisting of 541,488,893 people shows a very strong negative correlation between the proportion of Mexicans and percentage of population with at least doctorate degree education in the United States with a correlation coefficient (R) of -0.861 and weighted average of 1.2%, a difference of 15.0%.
Doctorate Degree Correlation Summary
| Measurement | Creek | Mexican |
| Minimum | 0.080% | 0.054% |
| Maximum | 2.3% | 2.9% |
| Range | 2.2% | 2.8% |
| Mean | 0.88% | 0.92% |
| Median | 0.74% | 0.77% |
| Interquartile 25% (IQ1) | 0.50% | 0.43% |
| Interquartile 75% (IQ3) | 1.2% | 1.4% |
| Interquartile Range (IQR) | 0.71% | 0.94% |
| Standard Deviation (Sample) | 0.50% | 0.57% |
| Standard Deviation (Population) | 0.49% | 0.57% |
Similar Demographics by Doctorate Degree
Demographics Similar to Creek by Doctorate Degree
In terms of doctorate degree, the demographic groups most similar to Creek are Immigrants from Micronesia (1.3%, a difference of 0.050%), Navajo (1.4%, a difference of 0.30%), Immigrants from the Azores (1.4%, a difference of 0.51%), Dominican (1.4%, a difference of 0.53%), and Menominee (1.4%, a difference of 0.61%).
| Demographics | Rating | Rank | Doctorate Degree |
| Immigrants | Honduras | 0.1 /100 | #311 | Tragic 1.4% |
| Immigrants | Nicaragua | 0.1 /100 | #312 | Tragic 1.4% |
| Menominee | 0.1 /100 | #313 | Tragic 1.4% |
| Dominicans | 0.1 /100 | #314 | Tragic 1.4% |
| Immigrants | Azores | 0.1 /100 | #315 | Tragic 1.4% |
| Navajo | 0.1 /100 | #316 | Tragic 1.4% |
| Immigrants | Micronesia | 0.1 /100 | #317 | Tragic 1.3% |
| Creek | 0.1 /100 | #318 | Tragic 1.3% |
| Immigrants | Guyana | 0.1 /100 | #319 | Tragic 1.3% |
| Immigrants | St. Vincent and the Grenadines | 0.1 /100 | #320 | Tragic 1.3% |
| Dutch West Indians | 0.1 /100 | #321 | Tragic 1.3% |
| Seminole | 0.1 /100 | #322 | Tragic 1.3% |
| Immigrants | Belize | 0.1 /100 | #323 | Tragic 1.3% |
| Natives/Alaskans | 0.0 /100 | #324 | Tragic 1.3% |
| Pima | 0.0 /100 | #325 | Tragic 1.3% |
Demographics Similar to Mexicans by Doctorate Degree
In terms of doctorate degree, the demographic groups most similar to Mexicans are Arapaho (1.2%, a difference of 0.38%), Immigrants from Cuba (1.2%, a difference of 0.48%), Immigrants from Central America (1.2%, a difference of 1.3%), Puget Sound Salish (1.2%, a difference of 2.6%), and Bangladeshi (1.2%, a difference of 3.4%).
| Demographics | Rating | Rank | Doctorate Degree |
| Immigrants | Caribbean | 0.0 /100 | #333 | Tragic 1.3% |
| Immigrants | Dominican Republic | 0.0 /100 | #334 | Tragic 1.3% |
| Immigrants | Haiti | 0.0 /100 | #335 | Tragic 1.3% |
| Nepalese | 0.0 /100 | #336 | Tragic 1.3% |
| Bangladeshis | 0.0 /100 | #337 | Tragic 1.2% |
| Puget Sound Salish | 0.0 /100 | #338 | Tragic 1.2% |
| Immigrants | Central America | 0.0 /100 | #339 | Tragic 1.2% |
| Immigrants | Cuba | 0.0 /100 | #340 | Tragic 1.2% |
| Mexicans | 0.0 /100 | #341 | Tragic 1.2% |
| Arapaho | 0.0 /100 | #342 | Tragic 1.2% |
| Fijians | 0.0 /100 | #343 | Tragic 1.1% |
| Immigrants | Mexico | 0.0 /100 | #344 | Tragic 1.1% |
| Lumbee | 0.0 /100 | #345 | Tragic 1.1% |
| Spanish American Indians | 0.0 /100 | #346 | Tragic 1.1% |
| Houma | 0.0 /100 | #347 | Tragic 0.96% |