Creek vs Immigrants from Switzerland Kindergarten
COMPARE
Creek
Immigrants from Switzerland
Kindergarten
Kindergarten Comparison
Creek
Immigrants from Switzerland
98.4%
KINDERGARTEN
99.7/ 100
METRIC RATING
60th/ 347
METRIC RANK
98.2%
KINDERGARTEN
97.2/ 100
METRIC RATING
108th/ 347
METRIC RANK
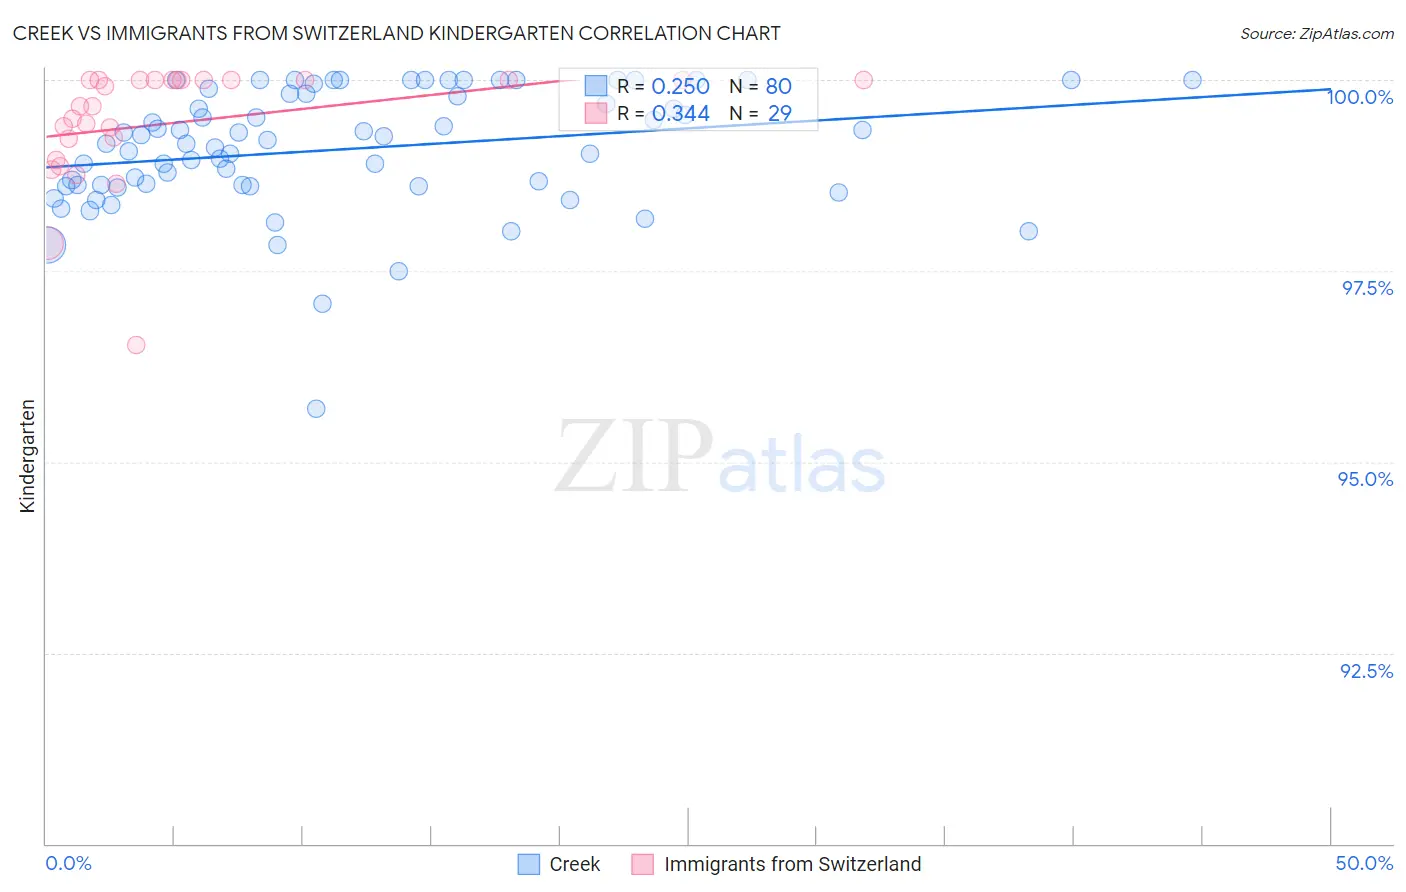
Creek vs Immigrants from Switzerland Kindergarten Correlation Chart
The statistical analysis conducted on geographies consisting of 178,480,663 people shows a weak positive correlation between the proportion of Creek and percentage of population with at least kindergarten education in the United States with a correlation coefficient (R) of 0.250 and weighted average of 98.4%. Similarly, the statistical analysis conducted on geographies consisting of 148,082,451 people shows a mild positive correlation between the proportion of Immigrants from Switzerland and percentage of population with at least kindergarten education in the United States with a correlation coefficient (R) of 0.344 and weighted average of 98.2%, a difference of 0.18%.
Kindergarten Correlation Summary
| Measurement | Creek | Immigrants from Switzerland |
| Minimum | 95.7% | 96.5% |
| Maximum | 100.0% | 100.0% |
| Range | 4.3% | 3.5% |
| Mean | 99.1% | 99.4% |
| Median | 99.2% | 99.7% |
| Interquartile 25% (IQ1) | 98.6% | 99.1% |
| Interquartile 75% (IQ3) | 99.8% | 100.0% |
| Interquartile Range (IQR) | 1.2% | 0.91% |
| Standard Deviation (Sample) | 0.80% | 0.79% |
| Standard Deviation (Population) | 0.80% | 0.78% |
Similar Demographics by Kindergarten
Demographics Similar to Creek by Kindergarten
In terms of kindergarten, the demographic groups most similar to Creek are Bulgarian (98.4%, a difference of 0.0%), Immigrants from Canada (98.4%, a difference of 0.0%), Slavic (98.4%, a difference of 0.0%), New Zealander (98.4%, a difference of 0.0%), and Immigrants from North America (98.4%, a difference of 0.0%).
| Demographics | Rating | Rank | Kindergarten |
| Celtics | 99.8 /100 | #53 | Exceptional 98.4% |
| Pueblo | 99.8 /100 | #54 | Exceptional 98.4% |
| Immigrants | Scotland | 99.8 /100 | #55 | Exceptional 98.4% |
| Americans | 99.8 /100 | #56 | Exceptional 98.4% |
| Austrians | 99.8 /100 | #57 | Exceptional 98.4% |
| Bulgarians | 99.7 /100 | #58 | Exceptional 98.4% |
| Immigrants | Canada | 99.7 /100 | #59 | Exceptional 98.4% |
| Creek | 99.7 /100 | #60 | Exceptional 98.4% |
| Slavs | 99.7 /100 | #61 | Exceptional 98.4% |
| New Zealanders | 99.7 /100 | #62 | Exceptional 98.4% |
| Immigrants | North America | 99.7 /100 | #63 | Exceptional 98.4% |
| Greeks | 99.7 /100 | #64 | Exceptional 98.4% |
| Maltese | 99.7 /100 | #65 | Exceptional 98.4% |
| Cheyenne | 99.6 /100 | #66 | Exceptional 98.4% |
| Canadians | 99.6 /100 | #67 | Exceptional 98.4% |
Demographics Similar to Immigrants from Switzerland by Kindergarten
In terms of kindergarten, the demographic groups most similar to Immigrants from Switzerland are Bhutanese (98.2%, a difference of 0.0%), Pima (98.2%, a difference of 0.0%), Basque (98.2%, a difference of 0.0%), Turkish (98.2%, a difference of 0.0%), and German Russian (98.2%, a difference of 0.0%).
| Demographics | Rating | Rank | Kindergarten |
| Romanians | 97.8 /100 | #101 | Exceptional 98.2% |
| Cree | 97.7 /100 | #102 | Exceptional 98.2% |
| Immigrants | Ireland | 97.6 /100 | #103 | Exceptional 98.2% |
| Bhutanese | 97.3 /100 | #104 | Exceptional 98.2% |
| Pima | 97.3 /100 | #105 | Exceptional 98.2% |
| Basques | 97.3 /100 | #106 | Exceptional 98.2% |
| Turks | 97.3 /100 | #107 | Exceptional 98.2% |
| Immigrants | Switzerland | 97.2 /100 | #108 | Exceptional 98.2% |
| German Russians | 97.1 /100 | #109 | Exceptional 98.2% |
| Immigrants | Singapore | 96.8 /100 | #110 | Exceptional 98.2% |
| Immigrants | Norway | 96.6 /100 | #111 | Exceptional 98.2% |
| Immigrants | Czechoslovakia | 96.6 /100 | #112 | Exceptional 98.2% |
| Immigrants | Latvia | 96.3 /100 | #113 | Exceptional 98.2% |
| Ute | 96.3 /100 | #114 | Exceptional 98.2% |
| Iranians | 96.2 /100 | #115 | Exceptional 98.2% |