Creek vs Immigrants from Hungary College, 1 year or more
COMPARE
Creek
Immigrants from Hungary
College, 1 year or more
College, 1 year or more Comparison
Creek
Immigrants from Hungary
52.2%
COLLEGE, 1 YEAR OR MORE
0.0/ 100
METRIC RATING
303rd/ 347
METRIC RANK
62.7%
COLLEGE, 1 YEAR OR MORE
98.6/ 100
METRIC RATING
87th/ 347
METRIC RANK
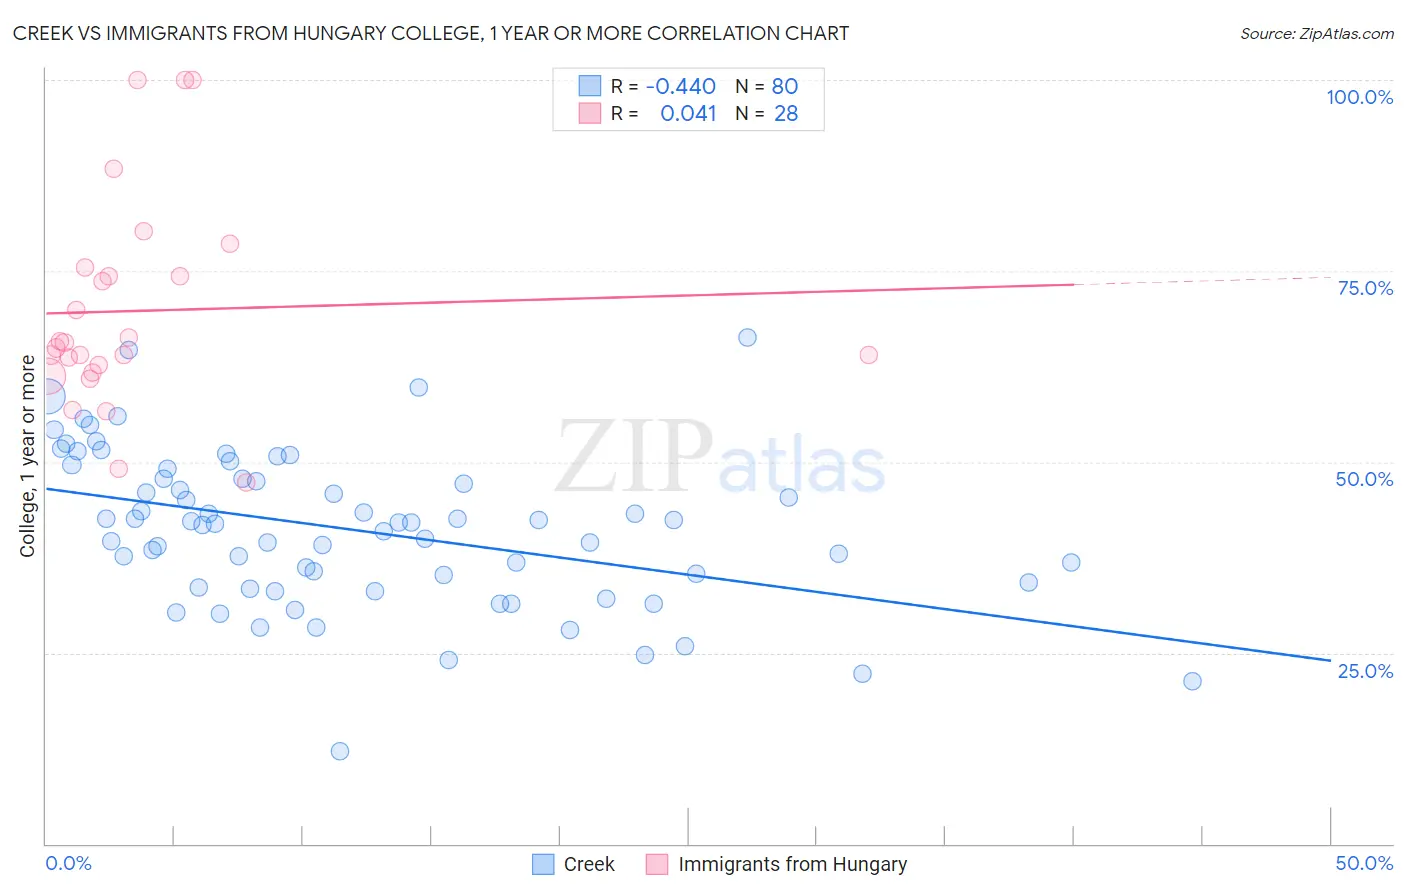
Creek vs Immigrants from Hungary College, 1 year or more Correlation Chart
The statistical analysis conducted on geographies consisting of 178,480,714 people shows a moderate negative correlation between the proportion of Creek and percentage of population with at least college, 1 year or more education in the United States with a correlation coefficient (R) of -0.440 and weighted average of 52.2%. Similarly, the statistical analysis conducted on geographies consisting of 195,707,305 people shows no correlation between the proportion of Immigrants from Hungary and percentage of population with at least college, 1 year or more education in the United States with a correlation coefficient (R) of 0.041 and weighted average of 62.7%, a difference of 20.2%.
College, 1 year or more Correlation Summary
| Measurement | Creek | Immigrants from Hungary |
| Minimum | 12.0% | 47.4% |
| Maximum | 66.3% | 100.0% |
| Range | 54.2% | 52.6% |
| Mean | 41.1% | 69.8% |
| Median | 42.0% | 65.3% |
| Interquartile 25% (IQ1) | 33.9% | 62.2% |
| Interquartile 75% (IQ3) | 47.8% | 74.9% |
| Interquartile Range (IQR) | 13.9% | 12.7% |
| Standard Deviation (Sample) | 10.1% | 13.8% |
| Standard Deviation (Population) | 10.1% | 13.5% |
Similar Demographics by College, 1 year or more
Demographics Similar to Creek by College, 1 year or more
In terms of college, 1 year or more, the demographic groups most similar to Creek are Puerto Rican (52.2%, a difference of 0.080%), Central American (52.1%, a difference of 0.14%), Haitian (52.3%, a difference of 0.21%), Seminole (52.1%, a difference of 0.23%), and Choctaw (52.3%, a difference of 0.26%).
| Demographics | Rating | Rank | College, 1 year or more |
| Sioux | 0.0 /100 | #296 | Tragic 53.0% |
| Paiute | 0.0 /100 | #297 | Tragic 52.9% |
| Immigrants | Dominica | 0.0 /100 | #298 | Tragic 52.5% |
| Immigrants | Nicaragua | 0.0 /100 | #299 | Tragic 52.4% |
| Choctaw | 0.0 /100 | #300 | Tragic 52.3% |
| Haitians | 0.0 /100 | #301 | Tragic 52.3% |
| Puerto Ricans | 0.0 /100 | #302 | Tragic 52.2% |
| Creek | 0.0 /100 | #303 | Tragic 52.2% |
| Central Americans | 0.0 /100 | #304 | Tragic 52.1% |
| Seminole | 0.0 /100 | #305 | Tragic 52.1% |
| Mexican American Indians | 0.0 /100 | #306 | Tragic 51.9% |
| Immigrants | Portugal | 0.0 /100 | #307 | Tragic 51.9% |
| Salvadorans | 0.0 /100 | #308 | Tragic 51.8% |
| Apache | 0.0 /100 | #309 | Tragic 51.8% |
| Hondurans | 0.0 /100 | #310 | Tragic 51.6% |
Demographics Similar to Immigrants from Hungary by College, 1 year or more
In terms of college, 1 year or more, the demographic groups most similar to Immigrants from Hungary are Immigrants from Western Europe (62.7%, a difference of 0.020%), Immigrants from England (62.8%, a difference of 0.040%), Immigrants from Pakistan (62.8%, a difference of 0.040%), Immigrants from Argentina (62.8%, a difference of 0.080%), and Immigrants from Bolivia (62.8%, a difference of 0.11%).
| Demographics | Rating | Rank | College, 1 year or more |
| Lithuanians | 98.8 /100 | #80 | Exceptional 62.9% |
| Laotians | 98.7 /100 | #81 | Exceptional 62.8% |
| Immigrants | Bolivia | 98.7 /100 | #82 | Exceptional 62.8% |
| Immigrants | Argentina | 98.6 /100 | #83 | Exceptional 62.8% |
| Immigrants | England | 98.6 /100 | #84 | Exceptional 62.8% |
| Immigrants | Pakistan | 98.6 /100 | #85 | Exceptional 62.8% |
| Immigrants | Western Europe | 98.6 /100 | #86 | Exceptional 62.7% |
| Immigrants | Hungary | 98.6 /100 | #87 | Exceptional 62.7% |
| Greeks | 98.3 /100 | #88 | Exceptional 62.6% |
| Immigrants | Ethiopia | 98.2 /100 | #89 | Exceptional 62.6% |
| Immigrants | Western Asia | 97.9 /100 | #90 | Exceptional 62.5% |
| Immigrants | Eastern Europe | 97.8 /100 | #91 | Exceptional 62.4% |
| Immigrants | Egypt | 97.8 /100 | #92 | Exceptional 62.4% |
| Romanians | 97.7 /100 | #93 | Exceptional 62.4% |
| Immigrants | Croatia | 97.6 /100 | #94 | Exceptional 62.3% |