Cree vs Immigrants from Bangladesh 5th Grade
COMPARE
Cree
Immigrants from Bangladesh
5th Grade
5th Grade Comparison
Cree
Immigrants from Bangladesh
97.7%
5TH GRADE
98.4/ 100
METRIC RATING
97th/ 347
METRIC RANK
96.0%
5TH GRADE
0.0/ 100
METRIC RATING
311th/ 347
METRIC RANK
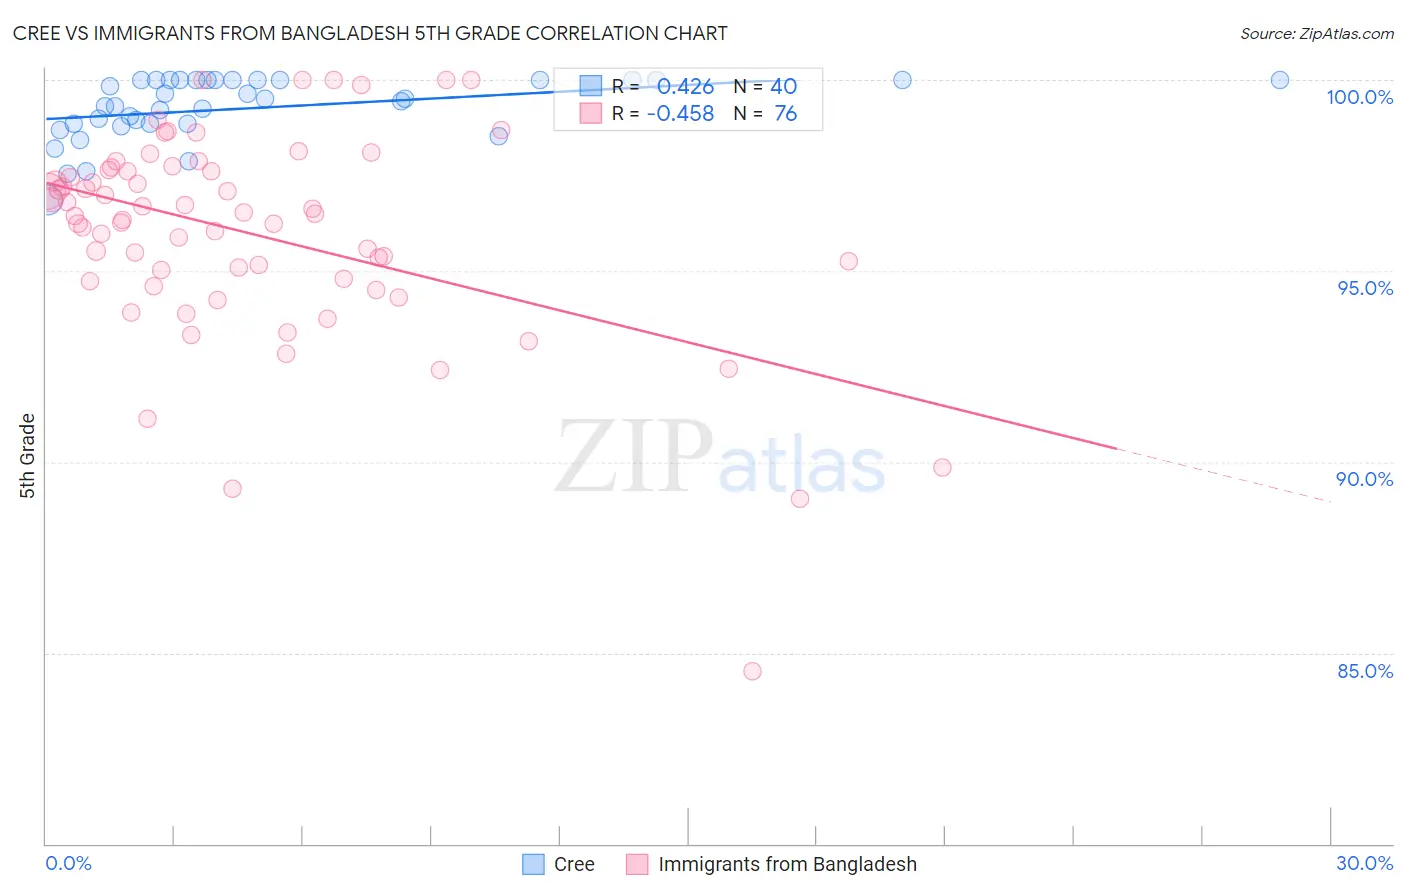
Cree vs Immigrants from Bangladesh 5th Grade Correlation Chart
The statistical analysis conducted on geographies consisting of 76,204,399 people shows a moderate positive correlation between the proportion of Cree and percentage of population with at least 5th grade education in the United States with a correlation coefficient (R) of 0.426 and weighted average of 97.7%. Similarly, the statistical analysis conducted on geographies consisting of 203,672,706 people shows a moderate negative correlation between the proportion of Immigrants from Bangladesh and percentage of population with at least 5th grade education in the United States with a correlation coefficient (R) of -0.458 and weighted average of 96.0%, a difference of 1.9%.
5th Grade Correlation Summary
| Measurement | Cree | Immigrants from Bangladesh |
| Minimum | 96.9% | 84.5% |
| Maximum | 100.0% | 100.0% |
| Range | 3.1% | 15.5% |
| Mean | 99.3% | 96.0% |
| Median | 99.5% | 96.5% |
| Interquartile 25% (IQ1) | 98.9% | 94.8% |
| Interquartile 75% (IQ3) | 100.0% | 97.6% |
| Interquartile Range (IQR) | 1.1% | 2.9% |
| Standard Deviation (Sample) | 0.81% | 2.7% |
| Standard Deviation (Population) | 0.80% | 2.7% |
Similar Demographics by 5th Grade
Demographics Similar to Cree by 5th Grade
In terms of 5th grade, the demographic groups most similar to Cree are Immigrants from Denmark (97.8%, a difference of 0.010%), Romanian (97.8%, a difference of 0.010%), Immigrants from Germany (97.8%, a difference of 0.010%), Yugoslavian (97.7%, a difference of 0.010%), and Turkish (97.7%, a difference of 0.010%).
| Demographics | Rating | Rank | 5th Grade |
| Immigrants | Ireland | 98.8 /100 | #90 | Exceptional 97.8% |
| Immigrants | Western Europe | 98.8 /100 | #91 | Exceptional 97.8% |
| Immigrants | Sweden | 98.7 /100 | #92 | Exceptional 97.8% |
| Delaware | 98.6 /100 | #93 | Exceptional 97.8% |
| Immigrants | Denmark | 98.6 /100 | #94 | Exceptional 97.8% |
| Romanians | 98.6 /100 | #95 | Exceptional 97.8% |
| Immigrants | Germany | 98.5 /100 | #96 | Exceptional 97.8% |
| Cree | 98.4 /100 | #97 | Exceptional 97.7% |
| Yugoslavians | 98.3 /100 | #98 | Exceptional 97.7% |
| Turks | 98.3 /100 | #99 | Exceptional 97.7% |
| Puget Sound Salish | 98.3 /100 | #100 | Exceptional 97.7% |
| South Africans | 98.3 /100 | #101 | Exceptional 97.7% |
| Choctaw | 98.0 /100 | #102 | Exceptional 97.7% |
| Cheyenne | 97.9 /100 | #103 | Exceptional 97.7% |
| German Russians | 97.8 /100 | #104 | Exceptional 97.7% |
Demographics Similar to Immigrants from Bangladesh by 5th Grade
In terms of 5th grade, the demographic groups most similar to Immigrants from Bangladesh are Indonesian (96.0%, a difference of 0.020%), Vietnamese (95.9%, a difference of 0.030%), Bangladeshi (95.9%, a difference of 0.050%), Immigrants from Portugal (95.9%, a difference of 0.050%), and Ecuadorian (96.0%, a difference of 0.070%).
| Demographics | Rating | Rank | 5th Grade |
| Immigrants | Burma/Myanmar | 0.0 /100 | #304 | Tragic 96.1% |
| Immigrants | Laos | 0.0 /100 | #305 | Tragic 96.0% |
| Immigrants | Haiti | 0.0 /100 | #306 | Tragic 96.0% |
| Immigrants | Caribbean | 0.0 /100 | #307 | Tragic 96.0% |
| Ecuadorians | 0.0 /100 | #308 | Tragic 96.0% |
| Immigrants | Guyana | 0.0 /100 | #309 | Tragic 96.0% |
| Indonesians | 0.0 /100 | #310 | Tragic 96.0% |
| Immigrants | Bangladesh | 0.0 /100 | #311 | Tragic 96.0% |
| Vietnamese | 0.0 /100 | #312 | Tragic 95.9% |
| Bangladeshis | 0.0 /100 | #313 | Tragic 95.9% |
| Immigrants | Portugal | 0.0 /100 | #314 | Tragic 95.9% |
| Nicaraguans | 0.0 /100 | #315 | Tragic 95.9% |
| Immigrants | Ecuador | 0.0 /100 | #316 | Tragic 95.8% |
| Belizeans | 0.0 /100 | #317 | Tragic 95.8% |
| Immigrants | Vietnam | 0.0 /100 | #318 | Tragic 95.8% |