Costa Rican vs Israeli Nursery School
COMPARE
Costa Rican
Israeli
Nursery School
Nursery School Comparison
Costa Ricans
Israelis
97.8%
NURSERY SCHOOL
11.3/ 100
METRIC RATING
209th/ 347
METRIC RANK
98.1%
NURSERY SCHOOL
88.2/ 100
METRIC RATING
137th/ 347
METRIC RANK
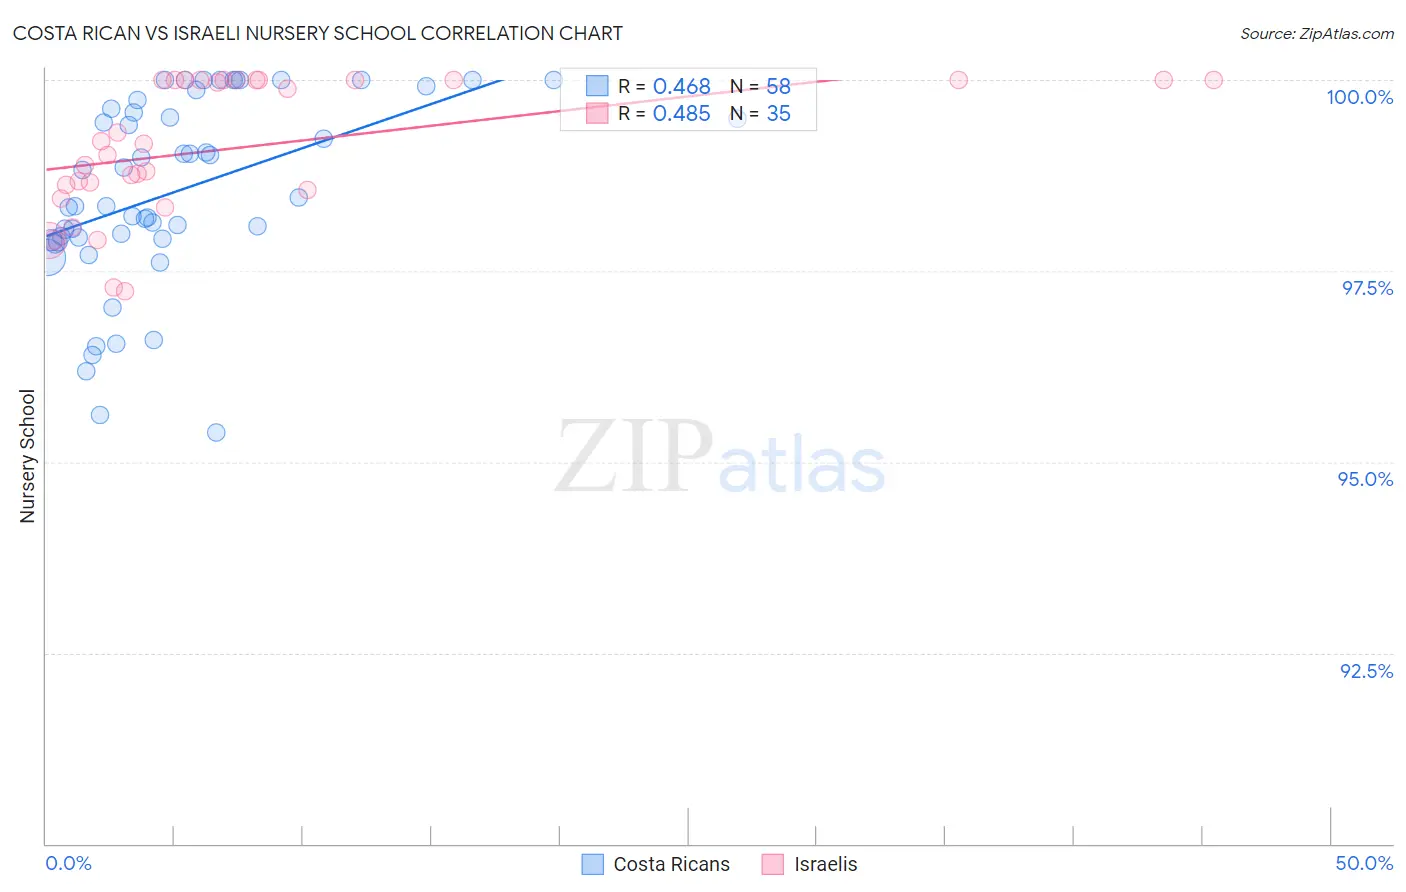
Costa Rican vs Israeli Nursery School Correlation Chart
The statistical analysis conducted on geographies consisting of 253,600,765 people shows a moderate positive correlation between the proportion of Costa Ricans and percentage of population with at least nursery school education in the United States with a correlation coefficient (R) of 0.468 and weighted average of 97.8%. Similarly, the statistical analysis conducted on geographies consisting of 211,219,690 people shows a moderate positive correlation between the proportion of Israelis and percentage of population with at least nursery school education in the United States with a correlation coefficient (R) of 0.485 and weighted average of 98.1%, a difference of 0.31%.
Nursery School Correlation Summary
| Measurement | Costa Rican | Israeli |
| Minimum | 95.4% | 97.2% |
| Maximum | 100.0% | 100.0% |
| Range | 4.6% | 2.8% |
| Mean | 98.5% | 99.1% |
| Median | 98.4% | 99.2% |
| Interquartile 25% (IQ1) | 97.9% | 98.6% |
| Interquartile 75% (IQ3) | 99.6% | 100.0% |
| Interquartile Range (IQR) | 1.7% | 1.4% |
| Standard Deviation (Sample) | 1.2% | 0.88% |
| Standard Deviation (Population) | 1.2% | 0.87% |
Similar Demographics by Nursery School
Demographics Similar to Costa Ricans by Nursery School
In terms of nursery school, the demographic groups most similar to Costa Ricans are Immigrants from Northern Africa (97.8%, a difference of 0.0%), Immigrants from Oceania (97.8%, a difference of 0.010%), Laotian (97.8%, a difference of 0.010%), Immigrants from Bahamas (97.8%, a difference of 0.020%), and Immigrants from Albania (97.9%, a difference of 0.030%).
| Demographics | Rating | Rank | Nursery School |
| Immigrants | Ukraine | 19.9 /100 | #202 | Poor 97.9% |
| Immigrants | Uganda | 18.0 /100 | #203 | Poor 97.9% |
| Immigrants | Southern Europe | 17.4 /100 | #204 | Poor 97.9% |
| Immigrants | Chile | 17.3 /100 | #205 | Poor 97.9% |
| Immigrants | Albania | 16.4 /100 | #206 | Poor 97.9% |
| Africans | 15.4 /100 | #207 | Poor 97.9% |
| Immigrants | Northern Africa | 11.7 /100 | #208 | Poor 97.8% |
| Costa Ricans | 11.3 /100 | #209 | Poor 97.8% |
| Immigrants | Oceania | 10.2 /100 | #210 | Poor 97.8% |
| Laotians | 9.8 /100 | #211 | Tragic 97.8% |
| Immigrants | Bahamas | 8.6 /100 | #212 | Tragic 97.8% |
| Moroccans | 8.3 /100 | #213 | Tragic 97.8% |
| South American Indians | 8.0 /100 | #214 | Tragic 97.8% |
| Bahamians | 7.4 /100 | #215 | Tragic 97.8% |
| Uruguayans | 7.1 /100 | #216 | Tragic 97.8% |
Demographics Similar to Israelis by Nursery School
In terms of nursery school, the demographic groups most similar to Israelis are Immigrants from Romania (98.1%, a difference of 0.0%), Blackfeet (98.1%, a difference of 0.0%), Immigrants from Bulgaria (98.1%, a difference of 0.010%), Immigrants from Hungary (98.1%, a difference of 0.010%), and Immigrants from Kuwait (98.1%, a difference of 0.010%).
| Demographics | Rating | Rank | Nursery School |
| Immigrants | Croatia | 91.4 /100 | #130 | Exceptional 98.2% |
| Spaniards | 91.1 /100 | #131 | Exceptional 98.2% |
| Seminole | 90.9 /100 | #132 | Exceptional 98.2% |
| Immigrants | Europe | 90.7 /100 | #133 | Exceptional 98.1% |
| Immigrants | Bulgaria | 89.4 /100 | #134 | Excellent 98.1% |
| Immigrants | Hungary | 89.3 /100 | #135 | Excellent 98.1% |
| Immigrants | Kuwait | 88.9 /100 | #136 | Excellent 98.1% |
| Israelis | 88.2 /100 | #137 | Excellent 98.1% |
| Immigrants | Romania | 88.0 /100 | #138 | Excellent 98.1% |
| Blackfeet | 87.5 /100 | #139 | Excellent 98.1% |
| Palestinians | 83.7 /100 | #140 | Excellent 98.1% |
| Immigrants | Turkey | 83.0 /100 | #141 | Excellent 98.1% |
| Burmese | 81.7 /100 | #142 | Excellent 98.1% |
| Marshallese | 81.2 /100 | #143 | Excellent 98.1% |
| Alsatians | 80.3 /100 | #144 | Excellent 98.1% |