Costa Rican vs Immigrants from Western Asia Kindergarten
COMPARE
Costa Rican
Immigrants from Western Asia
Kindergarten
Kindergarten Comparison
Costa Ricans
Immigrants from Western Asia
97.8%
KINDERGARTEN
11.6/ 100
METRIC RATING
209th/ 347
METRIC RANK
97.7%
KINDERGARTEN
2.1/ 100
METRIC RATING
236th/ 347
METRIC RANK
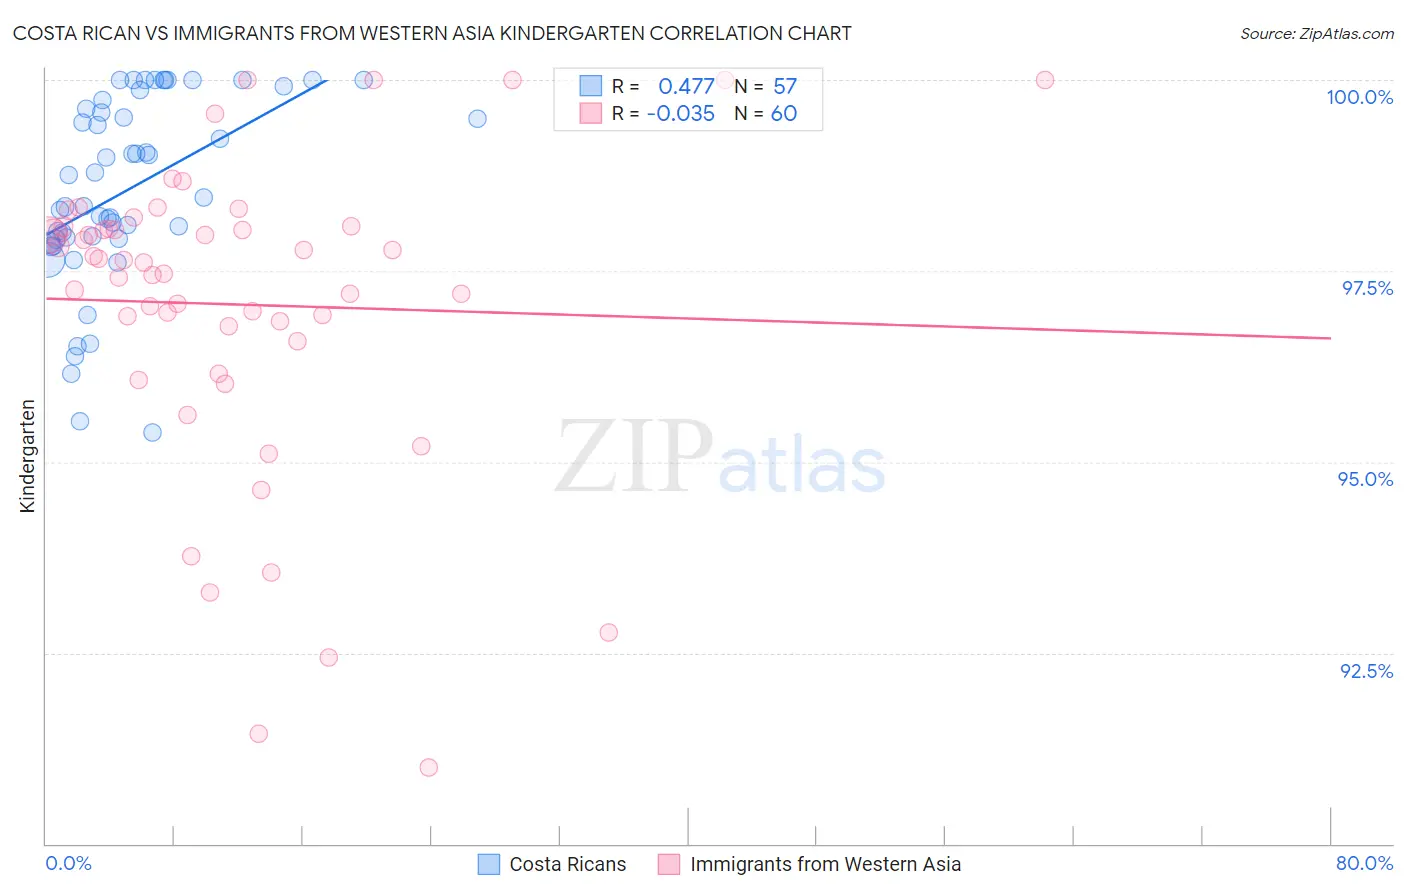
Costa Rican vs Immigrants from Western Asia Kindergarten Correlation Chart
The statistical analysis conducted on geographies consisting of 253,599,979 people shows a moderate positive correlation between the proportion of Costa Ricans and percentage of population with at least kindergarten education in the United States with a correlation coefficient (R) of 0.477 and weighted average of 97.8%. Similarly, the statistical analysis conducted on geographies consisting of 404,424,892 people shows no correlation between the proportion of Immigrants from Western Asia and percentage of population with at least kindergarten education in the United States with a correlation coefficient (R) of -0.035 and weighted average of 97.7%, a difference of 0.14%.
Kindergarten Correlation Summary
| Measurement | Costa Rican | Immigrants from Western Asia |
| Minimum | 95.4% | 91.0% |
| Maximum | 100.0% | 100.0% |
| Range | 4.6% | 9.0% |
| Mean | 98.6% | 97.1% |
| Median | 98.5% | 97.6% |
| Interquartile 25% (IQ1) | 97.9% | 96.7% |
| Interquartile 75% (IQ3) | 99.7% | 98.1% |
| Interquartile Range (IQR) | 1.8% | 1.4% |
| Standard Deviation (Sample) | 1.2% | 2.0% |
| Standard Deviation (Population) | 1.2% | 2.0% |
Similar Demographics by Kindergarten
Demographics Similar to Costa Ricans by Kindergarten
In terms of kindergarten, the demographic groups most similar to Costa Ricans are Immigrants from Northern Africa (97.8%, a difference of 0.0%), Immigrants from Oceania (97.8%, a difference of 0.0%), Laotian (97.8%, a difference of 0.010%), Moroccan (97.8%, a difference of 0.020%), and Immigrants from Albania (97.8%, a difference of 0.030%).
| Demographics | Rating | Rank | Kindergarten |
| Immigrants | Ukraine | 19.1 /100 | #202 | Poor 97.8% |
| Immigrants | Uganda | 18.8 /100 | #203 | Poor 97.8% |
| Immigrants | Chile | 18.1 /100 | #204 | Poor 97.8% |
| Immigrants | Southern Europe | 18.0 /100 | #205 | Poor 97.8% |
| Immigrants | Albania | 16.4 /100 | #206 | Poor 97.8% |
| Africans | 16.1 /100 | #207 | Poor 97.8% |
| Immigrants | Northern Africa | 12.0 /100 | #208 | Poor 97.8% |
| Costa Ricans | 11.6 /100 | #209 | Poor 97.8% |
| Immigrants | Oceania | 11.1 /100 | #210 | Poor 97.8% |
| Laotians | 10.5 /100 | #211 | Poor 97.8% |
| Moroccans | 8.9 /100 | #212 | Tragic 97.8% |
| South American Indians | 7.7 /100 | #213 | Tragic 97.8% |
| Uruguayans | 7.5 /100 | #214 | Tragic 97.8% |
| Immigrants | Bahamas | 7.4 /100 | #215 | Tragic 97.8% |
| Samoans | 6.9 /100 | #216 | Tragic 97.8% |
Demographics Similar to Immigrants from Western Asia by Kindergarten
In terms of kindergarten, the demographic groups most similar to Immigrants from Western Asia are Immigrants from Pakistan (97.7%, a difference of 0.0%), Immigrants from Malaysia (97.7%, a difference of 0.0%), Colombian (97.7%, a difference of 0.0%), Immigrants from Uruguay (97.7%, a difference of 0.010%), and Nigerian (97.6%, a difference of 0.010%).
| Demographics | Rating | Rank | Kindergarten |
| Sierra Leoneans | 3.4 /100 | #229 | Tragic 97.7% |
| Senegalese | 3.3 /100 | #230 | Tragic 97.7% |
| Puerto Ricans | 2.7 /100 | #231 | Tragic 97.7% |
| Immigrants | Uruguay | 2.6 /100 | #232 | Tragic 97.7% |
| Immigrants | Pakistan | 2.2 /100 | #233 | Tragic 97.7% |
| Immigrants | Malaysia | 2.2 /100 | #234 | Tragic 97.7% |
| Colombians | 2.2 /100 | #235 | Tragic 97.7% |
| Immigrants | Western Asia | 2.1 /100 | #236 | Tragic 97.7% |
| Nigerians | 1.8 /100 | #237 | Tragic 97.6% |
| Immigrants | Eastern Asia | 1.7 /100 | #238 | Tragic 97.6% |
| U.S. Virgin Islanders | 1.7 /100 | #239 | Tragic 97.6% |
| Koreans | 1.6 /100 | #240 | Tragic 97.6% |
| Liberians | 1.3 /100 | #241 | Tragic 97.6% |
| Immigrants | Indonesia | 1.3 /100 | #242 | Tragic 97.6% |
| Asians | 1.2 /100 | #243 | Tragic 97.6% |