Comanche vs Immigrants from Serbia Master's Degree
COMPARE
Comanche
Immigrants from Serbia
Master's Degree
Master's Degree Comparison
Comanche
Immigrants from Serbia
12.1%
MASTER'S DEGREE
0.3/ 100
METRIC RATING
272nd/ 347
METRIC RANK
18.5%
MASTER'S DEGREE
99.9/ 100
METRIC RATING
55th/ 347
METRIC RANK
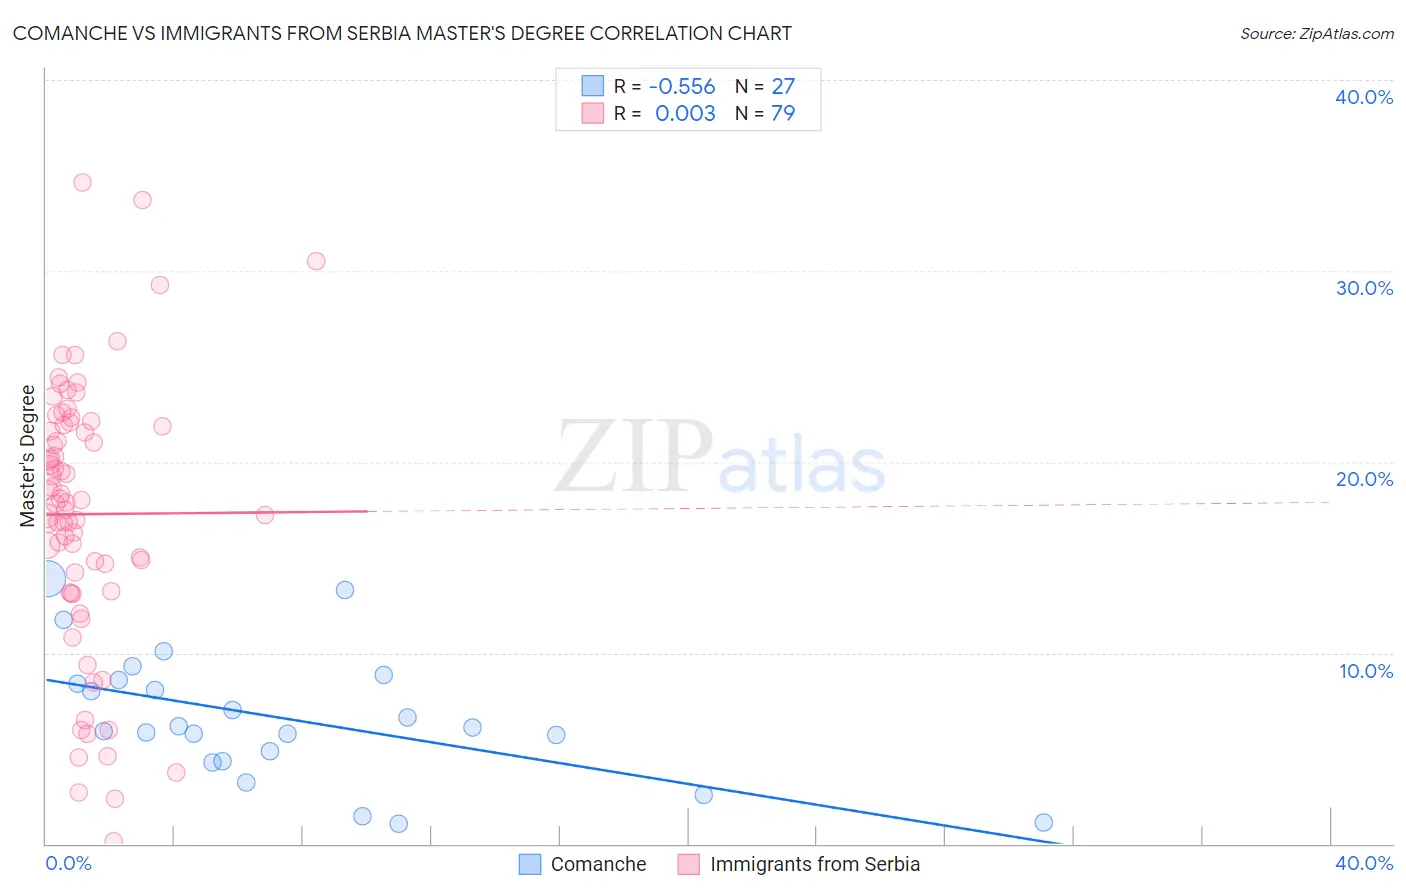
Comanche vs Immigrants from Serbia Master's Degree Correlation Chart
The statistical analysis conducted on geographies consisting of 109,770,893 people shows a substantial negative correlation between the proportion of Comanche and percentage of population with at least master's degree education in the United States with a correlation coefficient (R) of -0.556 and weighted average of 12.1%. Similarly, the statistical analysis conducted on geographies consisting of 131,731,006 people shows no correlation between the proportion of Immigrants from Serbia and percentage of population with at least master's degree education in the United States with a correlation coefficient (R) of 0.003 and weighted average of 18.5%, a difference of 52.8%.
Master's Degree Correlation Summary
| Measurement | Comanche | Immigrants from Serbia |
| Minimum | 1.0% | 0.15% |
| Maximum | 13.9% | 34.6% |
| Range | 12.9% | 34.5% |
| Mean | 6.6% | 17.3% |
| Median | 6.1% | 17.9% |
| Interquartile 25% (IQ1) | 4.3% | 13.2% |
| Interquartile 75% (IQ3) | 8.6% | 22.0% |
| Interquartile Range (IQR) | 4.3% | 8.7% |
| Standard Deviation (Sample) | 3.4% | 7.1% |
| Standard Deviation (Population) | 3.3% | 7.0% |
Similar Demographics by Master's Degree
Demographics Similar to Comanche by Master's Degree
In terms of master's degree, the demographic groups most similar to Comanche are Haitian (12.1%, a difference of 0.060%), Blackfeet (12.1%, a difference of 0.090%), Cape Verdean (12.1%, a difference of 0.18%), Cuban (12.1%, a difference of 0.20%), and Black/African American (12.1%, a difference of 0.25%).
| Demographics | Rating | Rank | Master's Degree |
| Immigrants | Fiji | 0.5 /100 | #265 | Tragic 12.4% |
| Bahamians | 0.5 /100 | #266 | Tragic 12.4% |
| Americans | 0.4 /100 | #267 | Tragic 12.3% |
| Native Hawaiians | 0.4 /100 | #268 | Tragic 12.3% |
| Central Americans | 0.3 /100 | #269 | Tragic 12.2% |
| Salvadorans | 0.3 /100 | #270 | Tragic 12.2% |
| Haitians | 0.3 /100 | #271 | Tragic 12.1% |
| Comanche | 0.3 /100 | #272 | Tragic 12.1% |
| Blackfeet | 0.3 /100 | #273 | Tragic 12.1% |
| Cape Verdeans | 0.3 /100 | #274 | Tragic 12.1% |
| Cubans | 0.3 /100 | #275 | Tragic 12.1% |
| Blacks/African Americans | 0.3 /100 | #276 | Tragic 12.1% |
| Immigrants | Caribbean | 0.3 /100 | #277 | Tragic 12.1% |
| Potawatomi | 0.3 /100 | #278 | Tragic 12.1% |
| Immigrants | Belize | 0.2 /100 | #279 | Tragic 12.1% |
Demographics Similar to Immigrants from Serbia by Master's Degree
In terms of master's degree, the demographic groups most similar to Immigrants from Serbia are Immigrants from Lithuania (18.5%, a difference of 0.030%), Asian (18.4%, a difference of 0.22%), Immigrants from Czechoslovakia (18.5%, a difference of 0.34%), Immigrants from Asia (18.4%, a difference of 0.36%), and Immigrants from Kuwait (18.6%, a difference of 0.42%).
| Demographics | Rating | Rank | Master's Degree |
| Paraguayans | 100.0 /100 | #48 | Exceptional 18.8% |
| Estonians | 100.0 /100 | #49 | Exceptional 18.8% |
| Bulgarians | 100.0 /100 | #50 | Exceptional 18.8% |
| Immigrants | South Africa | 100.0 /100 | #51 | Exceptional 18.8% |
| Immigrants | Kuwait | 100.0 /100 | #52 | Exceptional 18.6% |
| Immigrants | Czechoslovakia | 99.9 /100 | #53 | Exceptional 18.5% |
| Immigrants | Lithuania | 99.9 /100 | #54 | Exceptional 18.5% |
| Immigrants | Serbia | 99.9 /100 | #55 | Exceptional 18.5% |
| Asians | 99.9 /100 | #56 | Exceptional 18.4% |
| Immigrants | Asia | 99.9 /100 | #57 | Exceptional 18.4% |
| Australians | 99.9 /100 | #58 | Exceptional 18.4% |
| Immigrants | Bulgaria | 99.9 /100 | #59 | Exceptional 18.3% |
| New Zealanders | 99.9 /100 | #60 | Exceptional 18.3% |
| Immigrants | Europe | 99.9 /100 | #61 | Exceptional 18.2% |
| Argentineans | 99.9 /100 | #62 | Exceptional 18.2% |