Comanche vs Immigrants from Latin America Bachelor's Degree
COMPARE
Comanche
Immigrants from Latin America
Bachelor's Degree
Bachelor's Degree Comparison
Comanche
Immigrants from Latin America
31.9%
BACHELOR'S DEGREE
0.2/ 100
METRIC RATING
272nd/ 347
METRIC RANK
30.1%
BACHELOR'S DEGREE
0.0/ 100
METRIC RATING
305th/ 347
METRIC RANK
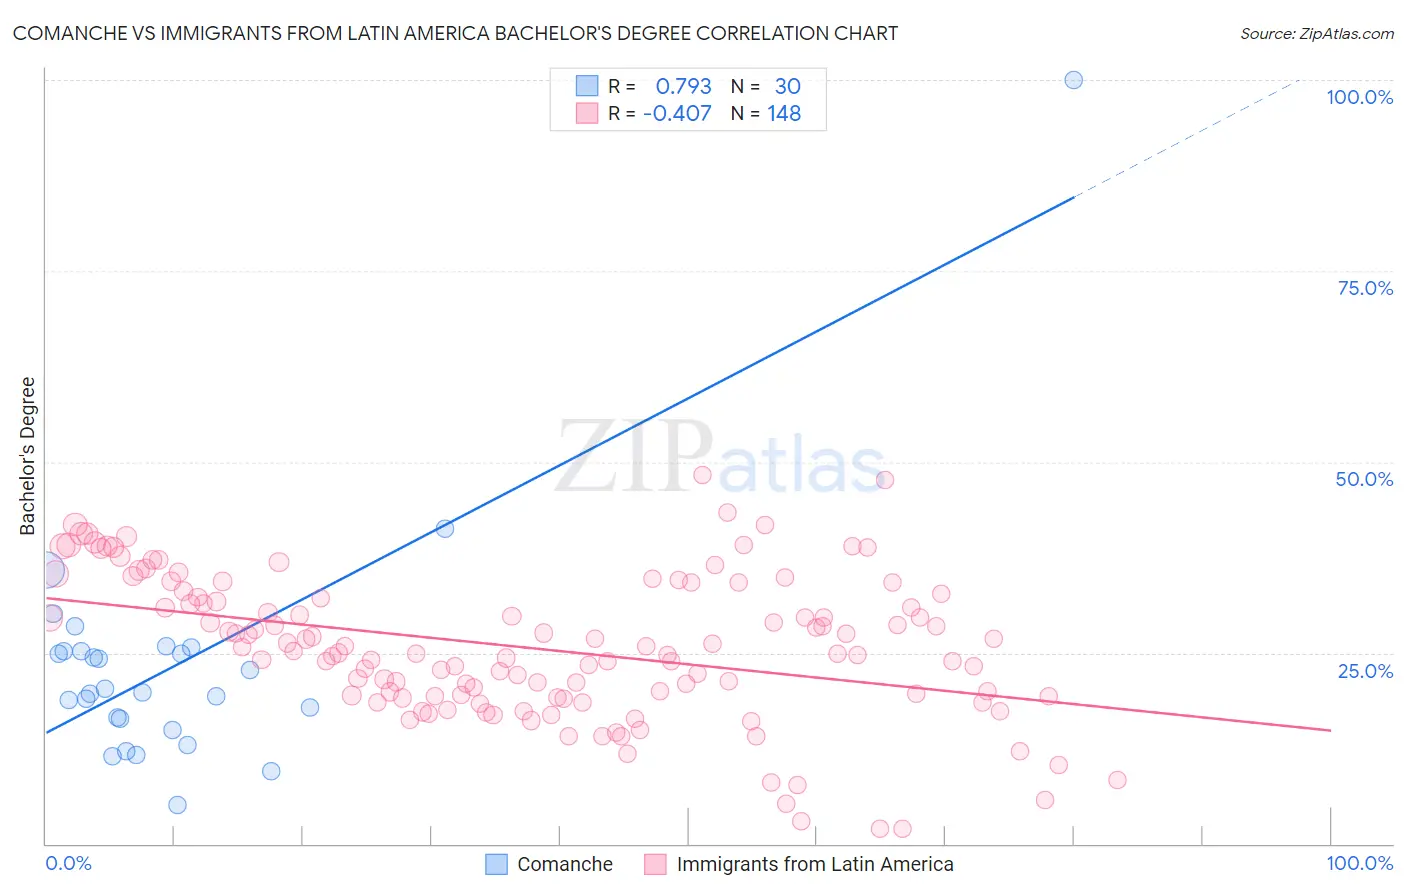
Comanche vs Immigrants from Latin America Bachelor's Degree Correlation Chart
The statistical analysis conducted on geographies consisting of 109,781,211 people shows a strong positive correlation between the proportion of Comanche and percentage of population with at least bachelor's degree education in the United States with a correlation coefficient (R) of 0.793 and weighted average of 31.9%. Similarly, the statistical analysis conducted on geographies consisting of 558,460,084 people shows a moderate negative correlation between the proportion of Immigrants from Latin America and percentage of population with at least bachelor's degree education in the United States with a correlation coefficient (R) of -0.407 and weighted average of 30.1%, a difference of 6.1%.
Bachelor's Degree Correlation Summary
| Measurement | Comanche | Immigrants from Latin America |
| Minimum | 5.1% | 1.9% |
| Maximum | 100.0% | 48.3% |
| Range | 94.9% | 46.4% |
| Mean | 23.5% | 25.7% |
| Median | 20.1% | 25.1% |
| Interquartile 25% (IQ1) | 16.4% | 19.3% |
| Interquartile 75% (IQ3) | 25.1% | 32.5% |
| Interquartile Range (IQR) | 8.7% | 13.2% |
| Standard Deviation (Sample) | 16.4% | 9.4% |
| Standard Deviation (Population) | 16.1% | 9.4% |
Similar Demographics by Bachelor's Degree
Demographics Similar to Comanche by Bachelor's Degree
In terms of bachelor's degree, the demographic groups most similar to Comanche are Central American (31.9%, a difference of 0.030%), Immigrants from Nicaragua (31.9%, a difference of 0.12%), American (31.9%, a difference of 0.12%), Potawatomi (31.9%, a difference of 0.14%), and Samoan (31.8%, a difference of 0.27%).
| Demographics | Rating | Rank | Bachelor's Degree |
| Bahamians | 0.3 /100 | #265 | Tragic 32.5% |
| Immigrants | Dominica | 0.3 /100 | #266 | Tragic 32.5% |
| Cubans | 0.3 /100 | #267 | Tragic 32.5% |
| Immigrants | Portugal | 0.2 /100 | #268 | Tragic 32.2% |
| Immigrants | Belize | 0.2 /100 | #269 | Tragic 32.1% |
| Immigrants | Nicaragua | 0.2 /100 | #270 | Tragic 31.9% |
| Central Americans | 0.2 /100 | #271 | Tragic 31.9% |
| Comanche | 0.2 /100 | #272 | Tragic 31.9% |
| Americans | 0.2 /100 | #273 | Tragic 31.9% |
| Potawatomi | 0.2 /100 | #274 | Tragic 31.9% |
| Samoans | 0.1 /100 | #275 | Tragic 31.8% |
| Salvadorans | 0.1 /100 | #276 | Tragic 31.8% |
| Dominicans | 0.1 /100 | #277 | Tragic 31.8% |
| Marshallese | 0.1 /100 | #278 | Tragic 31.7% |
| Hawaiians | 0.1 /100 | #279 | Tragic 31.6% |
Demographics Similar to Immigrants from Latin America by Bachelor's Degree
In terms of bachelor's degree, the demographic groups most similar to Immigrants from Latin America are Cherokee (30.2%, a difference of 0.42%), Bangladeshi (30.2%, a difference of 0.43%), Immigrants from Yemen (29.9%, a difference of 0.55%), Nepalese (29.9%, a difference of 0.58%), and Mexican American Indian (30.2%, a difference of 0.60%).
| Demographics | Rating | Rank | Bachelor's Degree |
| Chippewa | 0.0 /100 | #298 | Tragic 30.6% |
| Chickasaw | 0.0 /100 | #299 | Tragic 30.4% |
| Immigrants | Micronesia | 0.0 /100 | #300 | Tragic 30.4% |
| Immigrants | Cuba | 0.0 /100 | #301 | Tragic 30.3% |
| Mexican American Indians | 0.0 /100 | #302 | Tragic 30.2% |
| Bangladeshis | 0.0 /100 | #303 | Tragic 30.2% |
| Cherokee | 0.0 /100 | #304 | Tragic 30.2% |
| Immigrants | Latin America | 0.0 /100 | #305 | Tragic 30.1% |
| Immigrants | Yemen | 0.0 /100 | #306 | Tragic 29.9% |
| Nepalese | 0.0 /100 | #307 | Tragic 29.9% |
| Cajuns | 0.0 /100 | #308 | Tragic 29.6% |
| Hispanics or Latinos | 0.0 /100 | #309 | Tragic 29.6% |
| Cheyenne | 0.0 /100 | #310 | Tragic 29.4% |
| Choctaw | 0.0 /100 | #311 | Tragic 29.4% |
| Seminole | 0.0 /100 | #312 | Tragic 29.4% |