Comanche vs Immigrants from Laos 8th Grade
COMPARE
Comanche
Immigrants from Laos
8th Grade
8th Grade Comparison
Comanche
Immigrants from Laos
95.5%
8TH GRADE
16.3/ 100
METRIC RATING
206th/ 347
METRIC RANK
94.1%
8TH GRADE
0.0/ 100
METRIC RATING
301st/ 347
METRIC RANK
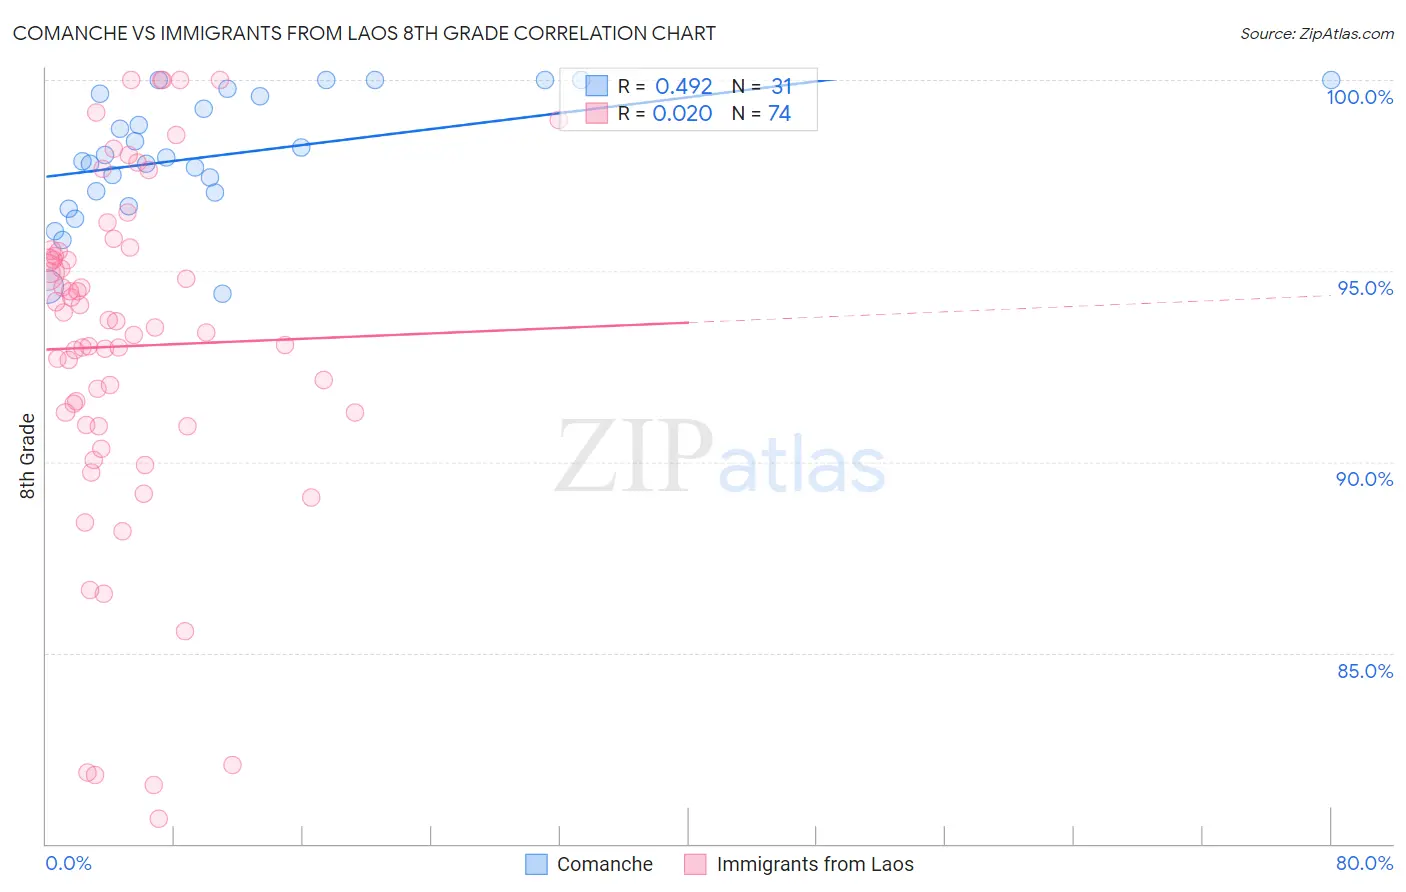
Comanche vs Immigrants from Laos 8th Grade Correlation Chart
The statistical analysis conducted on geographies consisting of 109,786,530 people shows a moderate positive correlation between the proportion of Comanche and percentage of population with at least 8th grade education in the United States with a correlation coefficient (R) of 0.492 and weighted average of 95.5%. Similarly, the statistical analysis conducted on geographies consisting of 201,472,886 people shows no correlation between the proportion of Immigrants from Laos and percentage of population with at least 8th grade education in the United States with a correlation coefficient (R) of 0.020 and weighted average of 94.1%, a difference of 1.5%.
8th Grade Correlation Summary
| Measurement | Comanche | Immigrants from Laos |
| Minimum | 94.4% | 80.6% |
| Maximum | 100.0% | 100.0% |
| Range | 5.6% | 19.4% |
| Mean | 98.0% | 93.0% |
| Median | 98.0% | 93.6% |
| Interquartile 25% (IQ1) | 97.1% | 91.0% |
| Interquartile 75% (IQ3) | 99.6% | 95.5% |
| Interquartile Range (IQR) | 2.6% | 4.6% |
| Standard Deviation (Sample) | 1.6% | 4.5% |
| Standard Deviation (Population) | 1.6% | 4.5% |
Similar Demographics by 8th Grade
Demographics Similar to Comanche by 8th Grade
In terms of 8th grade, the demographic groups most similar to Comanche are Immigrants from Bahamas (95.5%, a difference of 0.0%), Moroccan (95.5%, a difference of 0.010%), Hawaiian (95.5%, a difference of 0.010%), Immigrants from Sudan (95.5%, a difference of 0.020%), and Apache (95.5%, a difference of 0.030%).
| Demographics | Rating | Rank | 8th Grade |
| Immigrants | Northern Africa | 22.5 /100 | #199 | Fair 95.5% |
| Argentineans | 22.2 /100 | #200 | Fair 95.5% |
| Immigrants | Argentina | 20.6 /100 | #201 | Fair 95.5% |
| Apache | 19.4 /100 | #202 | Poor 95.5% |
| Moroccans | 17.4 /100 | #203 | Poor 95.5% |
| Hawaiians | 16.7 /100 | #204 | Poor 95.5% |
| Immigrants | Bahamas | 16.7 /100 | #205 | Poor 95.5% |
| Comanche | 16.3 /100 | #206 | Poor 95.5% |
| Immigrants | Sudan | 15.1 /100 | #207 | Poor 95.5% |
| Portuguese | 14.3 /100 | #208 | Poor 95.5% |
| Immigrants | Lebanon | 13.7 /100 | #209 | Poor 95.4% |
| Africans | 13.6 /100 | #210 | Poor 95.4% |
| Immigrants | Morocco | 12.4 /100 | #211 | Poor 95.4% |
| Immigrants | Pakistan | 9.7 /100 | #212 | Tragic 95.4% |
| Laotians | 9.0 /100 | #213 | Tragic 95.4% |
Demographics Similar to Immigrants from Laos by 8th Grade
In terms of 8th grade, the demographic groups most similar to Immigrants from Laos are Cuban (94.1%, a difference of 0.020%), Immigrants from Burma/Myanmar (94.1%, a difference of 0.020%), Indonesian (94.1%, a difference of 0.050%), Haitian (94.2%, a difference of 0.090%), and Immigrants from South Eastern Asia (94.2%, a difference of 0.090%).
| Demographics | Rating | Rank | 8th Grade |
| Houma | 0.0 /100 | #294 | Tragic 94.2% |
| Fijians | 0.0 /100 | #295 | Tragic 94.2% |
| Haitians | 0.0 /100 | #296 | Tragic 94.2% |
| Immigrants | South Eastern Asia | 0.0 /100 | #297 | Tragic 94.2% |
| Indonesians | 0.0 /100 | #298 | Tragic 94.1% |
| Cubans | 0.0 /100 | #299 | Tragic 94.1% |
| Immigrants | Burma/Myanmar | 0.0 /100 | #300 | Tragic 94.1% |
| Immigrants | Laos | 0.0 /100 | #301 | Tragic 94.1% |
| Sri Lankans | 0.0 /100 | #302 | Tragic 94.0% |
| Immigrants | Dominica | 0.0 /100 | #303 | Tragic 94.0% |
| Guyanese | 0.0 /100 | #304 | Tragic 93.9% |
| Immigrants | Haiti | 0.0 /100 | #305 | Tragic 93.9% |
| Immigrants | Guyana | 0.0 /100 | #306 | Tragic 93.8% |
| Immigrants | Portugal | 0.0 /100 | #307 | Tragic 93.8% |
| Ecuadorians | 0.0 /100 | #308 | Tragic 93.6% |