Colville vs Armenian 11th Grade
COMPARE
Colville
Armenian
11th Grade
11th Grade Comparison
Colville
Armenians
92.2%
11TH GRADE
21.8/ 100
METRIC RATING
208th/ 347
METRIC RANK
91.7%
11TH GRADE
2.9/ 100
METRIC RATING
234th/ 347
METRIC RANK
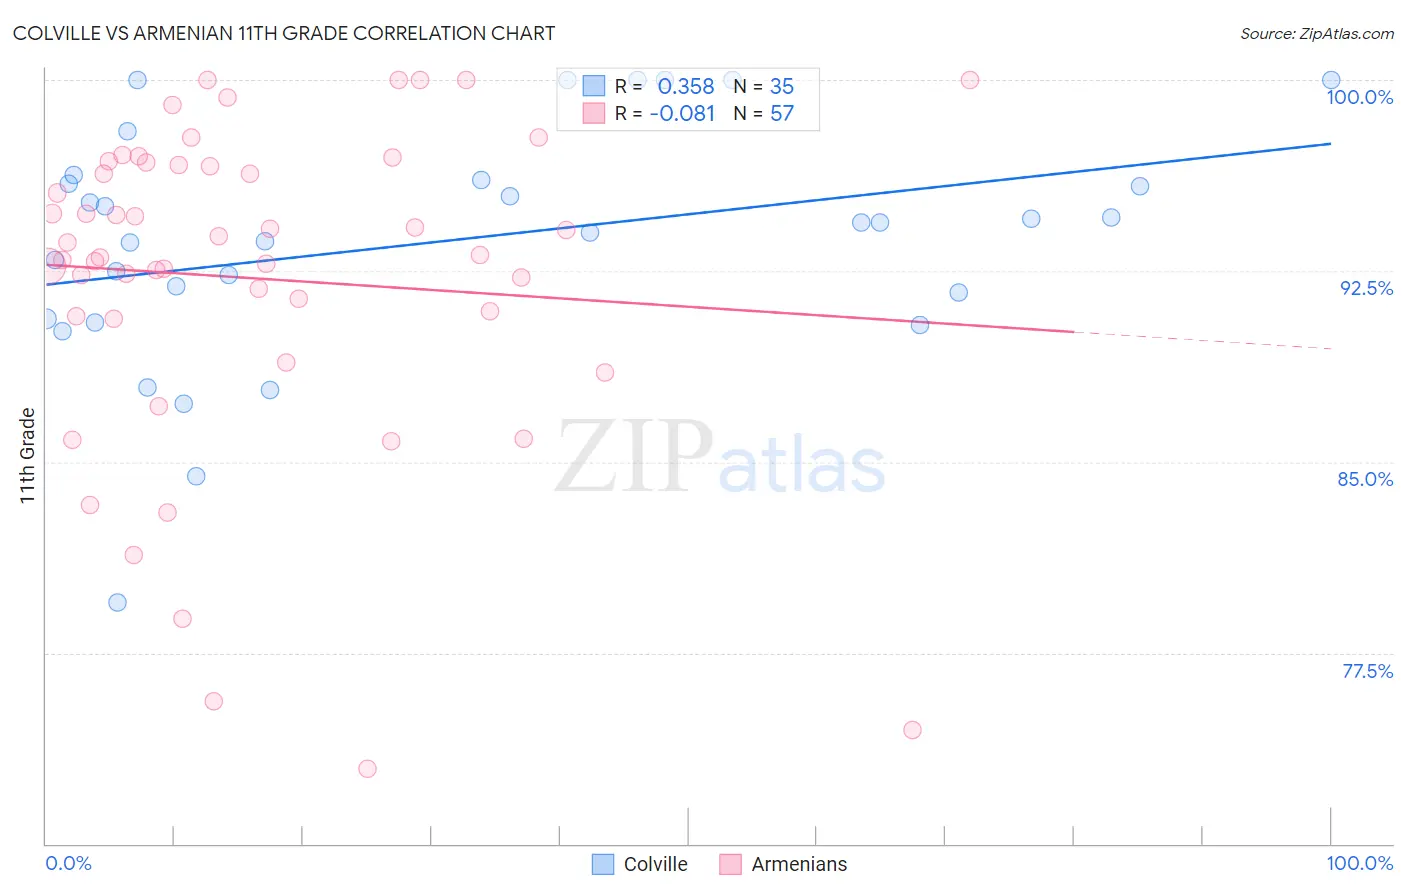
Colville vs Armenian 11th Grade Correlation Chart
The statistical analysis conducted on geographies consisting of 34,682,094 people shows a mild positive correlation between the proportion of Colville and percentage of population with at least 11th grade education in the United States with a correlation coefficient (R) of 0.358 and weighted average of 92.2%. Similarly, the statistical analysis conducted on geographies consisting of 310,954,801 people shows a slight negative correlation between the proportion of Armenians and percentage of population with at least 11th grade education in the United States with a correlation coefficient (R) of -0.081 and weighted average of 91.7%, a difference of 0.55%.
11th Grade Correlation Summary
| Measurement | Colville | Armenian |
| Minimum | 79.5% | 73.0% |
| Maximum | 100.0% | 100.0% |
| Range | 20.5% | 27.0% |
| Mean | 93.6% | 92.2% |
| Median | 94.4% | 93.1% |
| Interquartile 25% (IQ1) | 90.6% | 90.7% |
| Interquartile 75% (IQ3) | 96.1% | 96.7% |
| Interquartile Range (IQR) | 5.5% | 6.0% |
| Standard Deviation (Sample) | 4.7% | 6.4% |
| Standard Deviation (Population) | 4.6% | 6.4% |
Similar Demographics by 11th Grade
Demographics Similar to Colville by 11th Grade
In terms of 11th grade, the demographic groups most similar to Colville are Immigrants from Oceania (92.2%, a difference of 0.010%), Immigrants from Sudan (92.3%, a difference of 0.020%), Immigrants from Hong Kong (92.2%, a difference of 0.020%), Kiowa (92.2%, a difference of 0.020%), and Bolivian (92.2%, a difference of 0.020%).
| Demographics | Rating | Rank | 11th Grade |
| Immigrants | China | 25.1 /100 | #201 | Fair 92.3% |
| Immigrants | Eastern Africa | 24.1 /100 | #202 | Fair 92.3% |
| Immigrants | Sudan | 23.5 /100 | #203 | Fair 92.3% |
| Immigrants | Hong Kong | 23.3 /100 | #204 | Fair 92.2% |
| Kiowa | 23.2 /100 | #205 | Fair 92.2% |
| Bolivians | 23.2 /100 | #206 | Fair 92.2% |
| Immigrants | Oceania | 22.4 /100 | #207 | Fair 92.2% |
| Colville | 21.8 /100 | #208 | Fair 92.2% |
| Tongans | 19.8 /100 | #209 | Poor 92.2% |
| Ethiopians | 18.8 /100 | #210 | Poor 92.2% |
| Immigrants | Micronesia | 17.7 /100 | #211 | Poor 92.2% |
| Koreans | 14.4 /100 | #212 | Poor 92.1% |
| Immigrants | Ethiopia | 13.9 /100 | #213 | Poor 92.1% |
| Afghans | 12.8 /100 | #214 | Poor 92.1% |
| Immigrants | Southern Europe | 12.5 /100 | #215 | Poor 92.1% |
Demographics Similar to Armenians by 11th Grade
In terms of 11th grade, the demographic groups most similar to Armenians are Subsaharan African (91.7%, a difference of 0.0%), Colombian (91.7%, a difference of 0.010%), Immigrants from Bolivia (91.7%, a difference of 0.010%), Cheyenne (91.8%, a difference of 0.030%), and Comanche (91.7%, a difference of 0.030%).
| Demographics | Rating | Rank | 11th Grade |
| Immigrants | Cameroon | 4.4 /100 | #227 | Tragic 91.8% |
| Immigrants | Panama | 4.3 /100 | #228 | Tragic 91.8% |
| Nigerians | 4.3 /100 | #229 | Tragic 91.8% |
| Immigrants | Afghanistan | 3.9 /100 | #230 | Tragic 91.8% |
| Choctaw | 3.7 /100 | #231 | Tragic 91.8% |
| Uruguayans | 3.5 /100 | #232 | Tragic 91.8% |
| Cheyenne | 3.3 /100 | #233 | Tragic 91.8% |
| Armenians | 2.9 /100 | #234 | Tragic 91.7% |
| Sub-Saharan Africans | 2.9 /100 | #235 | Tragic 91.7% |
| Colombians | 2.8 /100 | #236 | Tragic 91.7% |
| Immigrants | Bolivia | 2.8 /100 | #237 | Tragic 91.7% |
| Comanche | 2.6 /100 | #238 | Tragic 91.7% |
| Hopi | 2.5 /100 | #239 | Tragic 91.7% |
| South Americans | 2.0 /100 | #240 | Tragic 91.6% |
| Bahamians | 1.8 /100 | #241 | Tragic 91.6% |