Choctaw vs Immigrants from Venezuela 3rd Grade

COMPARE

Choctaw
Race
Ancestry
AfghanAfricanAlaska NativeAlaskan AthabascanAlbanianAleutAlsatianAmericanApacheArabArapahoArgentineanArmenianAssyrian/Chaldean/SyriacAustralianAustrianBahamianBangladeshiBarbadianBasqueBelgianBelizeanBermudanBhutaneseBlackfeetBolivianBrazilianBritishBritish West IndianBulgarianBurmeseCajunCambodianCanadianCape VerdeanCarpatho RusynCelticCentral AmericanCentral American IndianCherokeeCheyenneChickasawChileanChineseChippewaChoctawColombianColvilleComancheCosta RicanCreeCreekCroatianCrowCubanCypriotCzechCzechoslovakianDanishDelawareDominicanDutchDutch West IndianEastern EuropeanEcuadorianEgyptianEnglishEstonianEthiopianEuropeanFijianFilipinoFinnishFrenchFrench American IndianFrench CanadianGermanGerman RussianGhanaianGreekGuamanian/ChamorroGuatemalanGuyaneseHaitianHmongHonduranHopiHoumaHungarianIcelanderIndian (Asian)IndonesianInupiatIranianIraqiIrishIroquoisIsraeliItalianJamaicanJapaneseJordanianKenyanKiowaKoreanLaotianLatvianLebaneseLiberianLithuanianLumbeeLuxembourgerMacedonianMalaysianMalteseMarshalleseMenomineeMexicanMexican American IndianMongolianMoroccanNative HawaiianNavajoNepaleseNew ZealanderNicaraguanNigerianNorthern EuropeanNorwegianOkinawanOsageOttawaPaiutePakistaniPalestinianPanamanianParaguayanPennsylvania GermanPeruvianPimaPolishPortuguesePotawatomiPuebloPuerto RicanPuget Sound SalishRomanianRussianSalvadoranSamoanScandinavianScotch-IrishScottishSeminoleSenegaleseSerbianShoshoneSierra LeoneanSiouxSlavicSlovakSloveneSomaliSouth AfricanSouth AmericanSouth American IndianSoviet UnionSpaniardSpanishSpanish AmericanSpanish American IndianSri LankanSubsaharan AfricanSudaneseSwedishSwissSyrianTaiwaneseThaiTlingit-HaidaTohono O'OdhamTonganTrinidadian and TobagonianTsimshianTurkishU.S. Virgin IslanderUgandanUkrainianUruguayanUteVenezuelanVietnameseWelshWest IndianYakamaYaquiYugoslavianYumanYup'ikZimbabwean
Immigration
NonimmigrantsImmigrantsAfghanistanAfricaAlbaniaArgentinaArmeniaAsiaAustraliaAustriaBahamasBangladeshBarbadosBelarusBelgiumBelizeBoliviaBosnia and HerzegovinaBrazilBulgariaBurma/MyanmarCabo VerdeCambodiaCameroonCanadaCaribbeanCentral AmericaChileChinaColombiaCongoCosta RicaCroatiaCubaCzechoslovakiaDenmarkDominicaDominican RepublicEastern AfricaEastern AsiaEastern EuropeEcuadorEgyptEl SalvadorEnglandEritreaEthiopiaEuropeFijiFranceGermanyGhanaGreeceGrenadaGuatemalaGuyanaHaitiHondurasHong KongHungaryIndiaIndonesiaIranIraqIrelandIsraelItalyJamaicaJapanJordanKazakhstanKenyaKoreaKuwaitLaosLatin AmericaLatviaLebanonLiberiaLithuaniaMalaysiaMexicoMicronesiaMiddle AfricaMoldovaMoroccoNepalNetherlandsNicaraguaNigeriaNorth AmericaNorth MacedoniaNorthern AfricaNorthern EuropeNorwayOceaniaPakistanPanamaPeruPhilippinesPolandPortugalRomaniaRussiaSaudi ArabiaScotlandSenegalSerbiaSierra LeoneSingaporeSomaliaSouth AfricaSouth AmericaSouth Central AsiaSouth Eastern AsiaSouthern EuropeSpainSri LankaSt. Vincent and the GrenadinesSudanSwedenSwitzerlandSyriaTaiwanThailandTrinidad and TobagoTurkeyUgandaUkraineUruguayUzbekistanVietnamWest IndiesWestern AfricaWestern AsiaWestern EuropeYemenZaireZimbabweAzores
Immigrants from Venezuela
Race
Ancestry
AfghanAfricanAlaska NativeAlaskan AthabascanAlbanianAleutAlsatianAmericanApacheArabArapahoArgentineanArmenianAssyrian/Chaldean/SyriacAustralianAustrianBahamianBangladeshiBarbadianBasqueBelgianBelizeanBermudanBhutaneseBlackfeetBolivianBrazilianBritishBritish West IndianBulgarianBurmeseCajunCambodianCanadianCape VerdeanCarpatho RusynCelticCentral AmericanCentral American IndianCherokeeCheyenneChickasawChileanChineseChippewaColombianColvilleComancheCosta RicanCreeCreekCroatianCrowCubanCypriotCzechCzechoslovakianDanishDelawareDominicanDutchDutch West IndianEastern EuropeanEcuadorianEgyptianEnglishEstonianEthiopianEuropeanFijianFilipinoFinnishFrenchFrench American IndianFrench CanadianGermanGerman RussianGhanaianGreekGuamanian/ChamorroGuatemalanGuyaneseHaitianHmongHonduranHopiHoumaHungarianIcelanderIndian (Asian)IndonesianInupiatIranianIraqiIrishIroquoisIsraeliItalianJamaicanJapaneseJordanianKenyanKiowaKoreanLaotianLatvianLebaneseLiberianLithuanianLumbeeLuxembourgerMacedonianMalaysianMalteseMarshalleseMenomineeMexicanMexican American IndianMongolianMoroccanNative HawaiianNavajoNepaleseNew ZealanderNicaraguanNigerianNorthern EuropeanNorwegianOkinawanOsageOttawaPaiutePakistaniPalestinianPanamanianParaguayanPennsylvania GermanPeruvianPimaPolishPortuguesePotawatomiPuebloPuerto RicanPuget Sound SalishRomanianRussianSalvadoranSamoanScandinavianScotch-IrishScottishSeminoleSenegaleseSerbianShoshoneSierra LeoneanSiouxSlavicSlovakSloveneSomaliSouth AfricanSouth AmericanSouth American IndianSoviet UnionSpaniardSpanishSpanish AmericanSpanish American IndianSri LankanSubsaharan AfricanSudaneseSwedishSwissSyrianTaiwaneseThaiTlingit-HaidaTohono O'OdhamTonganTrinidadian and TobagonianTsimshianTurkishU.S. Virgin IslanderUgandanUkrainianUruguayanUteVenezuelanVietnameseWelshWest IndianYakamaYaquiYugoslavianYumanYup'ikZimbabwean
Immigration
NonimmigrantsImmigrantsAfghanistanAfricaAlbaniaArgentinaArmeniaAsiaAustraliaAustriaBahamasBangladeshBarbadosBelarusBelgiumBelizeBoliviaBosnia and HerzegovinaBrazilBulgariaBurma/MyanmarCabo VerdeCambodiaCameroonCanadaCaribbeanCentral AmericaChileChinaColombiaCongoCosta RicaCroatiaCubaCzechoslovakiaDenmarkDominicaDominican RepublicEastern AfricaEastern AsiaEastern EuropeEcuadorEgyptEl SalvadorEnglandEritreaEthiopiaEuropeFijiFranceGermanyGhanaGreeceGrenadaGuatemalaGuyanaHaitiHondurasHong KongHungaryIndiaIndonesiaIranIraqIrelandIsraelItalyJamaicaJapanJordanKazakhstanKenyaKoreaKuwaitLaosLatin AmericaLatviaLebanonLiberiaLithuaniaMalaysiaMexicoMicronesiaMiddle AfricaMoldovaMoroccoNepalNetherlandsNicaraguaNigeriaNorth AmericaNorth MacedoniaNorthern AfricaNorthern EuropeNorwayOceaniaPakistanPanamaPeruPhilippinesPolandPortugalRomaniaRussiaSaudi ArabiaScotlandSenegalSerbiaSierra LeoneSingaporeSomaliaSouth AfricaSouth AmericaSouth Central AsiaSouth Eastern AsiaSouthern EuropeSpainSri LankaSt. Vincent and the GrenadinesSudanSwedenSwitzerlandSyriaTaiwanThailandTrinidad and TobagoTurkeyUgandaUkraineUruguayUzbekistanVenezuelaVietnamWest IndiesWestern AfricaWestern AsiaWestern EuropeYemenZaireZimbabweAzores
3rd Grade
Income
Poverty
Unemployment
Labor Participation
Family Structure
Vehicle Availability
Education Level
Disability

3rd Grade Comparison

Choctaw

Immigrants from Venezuela

Exceptional
Average
98.1%
3RD GRADE
98.0/ 100
METRIC RATING
98th/ 347
METRIC RANK
97.7%
3RD GRADE
44.4/ 100
METRIC RATING
181st/ 347
METRIC RANK

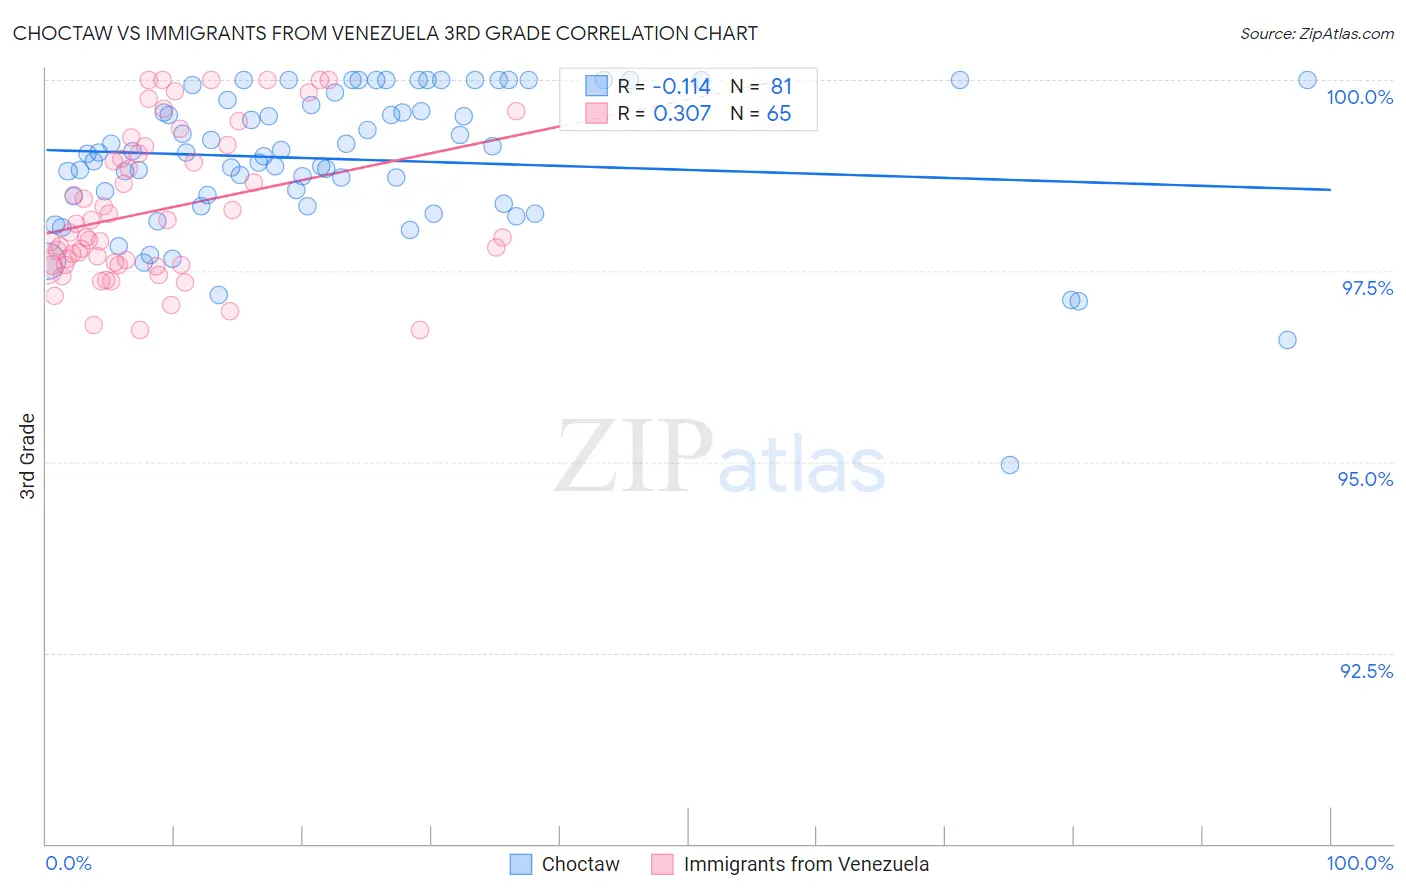
Choctaw vs Immigrants from Venezuela 3rd Grade Correlation Chart

The statistical analysis conducted on geographies consisting of 269,742,875 people shows a poor negative correlation between the proportion of Choctaw and percentage of population with at least 3rd grade education in the United States with a correlation coefficient (R) of -0.114 and weighted average of 98.1%. Similarly, the statistical analysis conducted on geographies consisting of 287,866,009 people shows a mild positive correlation between the proportion of Immigrants from Venezuela and percentage of population with at least 3rd grade education in the United States with a correlation coefficient (R) of 0.307 and weighted average of 97.7%, a difference of 0.35%.
Choctaw vs Immigrants from Venezuela 3rd Grade

3rd Grade Correlation Summary

MeasurementChoctawImmigrants from Venezuela
Minimum95.0%96.7%
Maximum100.0%100.0%
Range5.0%3.3%
Mean99.0%98.3%
Median99.1%97.9%
Interquartile 25% (IQ1)98.4%97.6%
Interquartile 75% (IQ3)99.8%99.1%
Interquartile Range (IQR)1.4%1.5%
Standard Deviation (Sample)0.95%0.96%
Standard Deviation (Population)0.94%0.95%

Similar Demographics by 3rd Grade

Demographics Similar to Choctaw by 3rd Grade

In terms of 3rd grade, the demographic groups most similar to Choctaw are Romanian (98.1%, a difference of 0.0%), Cree (98.1%, a difference of 0.0%), Immigrants from Ireland (98.1%, a difference of 0.010%), South African (98.1%, a difference of 0.010%), and Puget Sound Salish (98.1%, a difference of 0.010%).
DemographicsRating | Rank3rd Grade
Hopi
98.7
/100
|
#91
Exceptional
98.1%
Immigrants | South Africa
98.7
/100
|
#92
Exceptional
98.1%
Immigrants | Western Europe
98.7
/100
|
#93
Exceptional
98.1%
Immigrants | Germany
98.4
/100
|
#94
Exceptional
98.1%
Cypriots
98.4
/100
|
#95
Exceptional
98.1%
Immigrants | Ireland
98.2
/100
|
#96
Exceptional
98.1%
South Africans
98.2
/100
|
#97
Exceptional
98.1%
Choctaw
98.0
/100
|
#98
Exceptional
98.1%
Romanians
98.0
/100
|
#99
Exceptional
98.1%
Cree
97.9
/100
|
#100
Exceptional
98.1%
Puget Sound Salish
97.9
/100
|
#101
Exceptional
98.1%
Immigrants | Nonimmigrants
97.8
/100
|
#102
Exceptional
98.1%
Yugoslavians
97.7
/100
|
#103
Exceptional
98.1%
Turks
97.6
/100
|
#104
Exceptional
98.1%
German Russians
97.2
/100
|
#105
Exceptional
98.1%

Demographics Similar to Immigrants from Venezuela by 3rd Grade

In terms of 3rd grade, the demographic groups most similar to Immigrants from Venezuela are Immigrants from Sri Lanka (97.7%, a difference of 0.0%), Immigrants from Micronesia (97.8%, a difference of 0.010%), Immigrants from Poland (97.8%, a difference of 0.010%), Egyptian (97.7%, a difference of 0.010%), and Immigrants from Brazil (97.7%, a difference of 0.010%).
DemographicsRating | Rank3rd Grade
Navajo
50.0
/100
|
#174
Average
97.8%
Immigrants | Micronesia
47.6
/100
|
#175
Average
97.8%
Immigrants | Poland
47.1
/100
|
#176
Average
97.8%
Egyptians
46.6
/100
|
#177
Average
97.7%
Immigrants | Brazil
46.4
/100
|
#178
Average
97.7%
Immigrants | Belarus
45.9
/100
|
#179
Average
97.7%
Immigrants | Sri Lanka
45.1
/100
|
#180
Average
97.7%
Immigrants | Venezuela
44.4
/100
|
#181
Average
97.7%
Argentineans
42.9
/100
|
#182
Average
97.7%
Arabs
40.0
/100
|
#183
Fair
97.7%
Immigrants | Kazakhstan
37.4
/100
|
#184
Fair
97.7%
Immigrants | Argentina
37.0
/100
|
#185
Fair
97.7%
Portuguese
36.2
/100
|
#186
Fair
97.7%
Natives/Alaskans
35.2
/100
|
#187
Fair
97.7%
Immigrants | Taiwan
34.2
/100
|
#188
Fair
97.7%