Choctaw vs Immigrants from Somalia Bachelor's Degree
COMPARE
Choctaw
Immigrants from Somalia
Bachelor's Degree
Bachelor's Degree Comparison
Choctaw
Immigrants from Somalia
29.4%
BACHELOR'S DEGREE
0.0/ 100
METRIC RATING
311th/ 347
METRIC RANK
37.9%
BACHELOR'S DEGREE
52.8/ 100
METRIC RATING
172nd/ 347
METRIC RANK
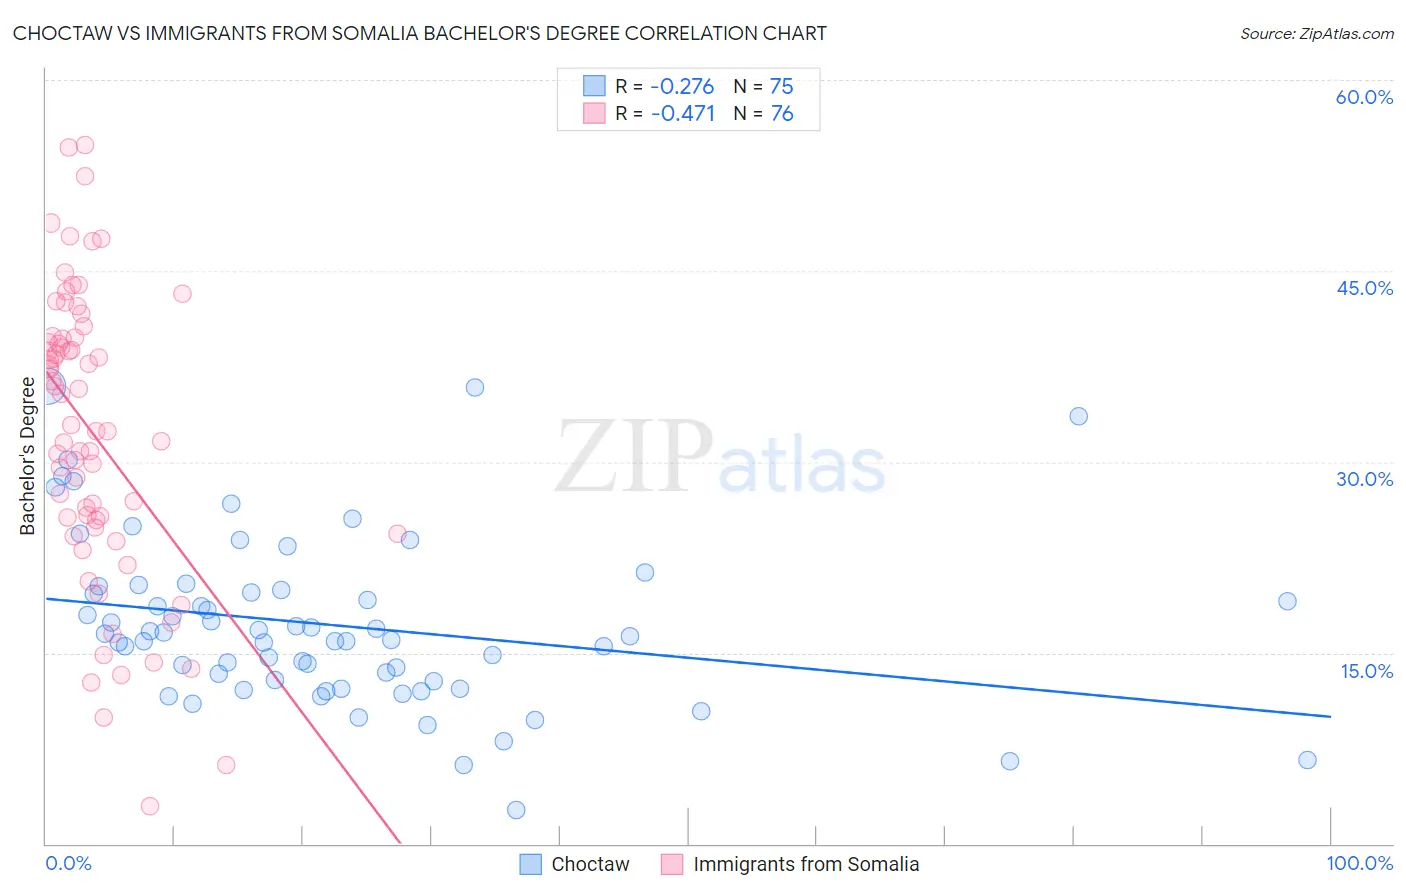
Choctaw vs Immigrants from Somalia Bachelor's Degree Correlation Chart
The statistical analysis conducted on geographies consisting of 269,719,391 people shows a weak negative correlation between the proportion of Choctaw and percentage of population with at least bachelor's degree education in the United States with a correlation coefficient (R) of -0.276 and weighted average of 29.4%. Similarly, the statistical analysis conducted on geographies consisting of 92,111,755 people shows a moderate negative correlation between the proportion of Immigrants from Somalia and percentage of population with at least bachelor's degree education in the United States with a correlation coefficient (R) of -0.471 and weighted average of 37.9%, a difference of 28.9%.
Bachelor's Degree Correlation Summary
| Measurement | Choctaw | Immigrants from Somalia |
| Minimum | 2.7% | 2.9% |
| Maximum | 35.9% | 54.9% |
| Range | 33.3% | 52.0% |
| Mean | 17.2% | 32.2% |
| Median | 16.3% | 32.7% |
| Interquartile 25% (IQ1) | 12.8% | 25.1% |
| Interquartile 75% (IQ3) | 20.0% | 39.7% |
| Interquartile Range (IQR) | 7.2% | 14.6% |
| Standard Deviation (Sample) | 6.6% | 11.4% |
| Standard Deviation (Population) | 6.6% | 11.3% |
Similar Demographics by Bachelor's Degree
Demographics Similar to Choctaw by Bachelor's Degree
In terms of bachelor's degree, the demographic groups most similar to Choctaw are Seminole (29.4%, a difference of 0.060%), Cheyenne (29.4%, a difference of 0.070%), Alaska Native (29.4%, a difference of 0.24%), Shoshone (29.3%, a difference of 0.53%), and Hispanic or Latino (29.6%, a difference of 0.54%).
| Demographics | Rating | Rank | Bachelor's Degree |
| Cherokee | 0.0 /100 | #304 | Tragic 30.2% |
| Immigrants | Latin America | 0.0 /100 | #305 | Tragic 30.1% |
| Immigrants | Yemen | 0.0 /100 | #306 | Tragic 29.9% |
| Nepalese | 0.0 /100 | #307 | Tragic 29.9% |
| Cajuns | 0.0 /100 | #308 | Tragic 29.6% |
| Hispanics or Latinos | 0.0 /100 | #309 | Tragic 29.6% |
| Cheyenne | 0.0 /100 | #310 | Tragic 29.4% |
| Choctaw | 0.0 /100 | #311 | Tragic 29.4% |
| Seminole | 0.0 /100 | #312 | Tragic 29.4% |
| Alaska Natives | 0.0 /100 | #313 | Tragic 29.4% |
| Shoshone | 0.0 /100 | #314 | Tragic 29.3% |
| Immigrants | Cabo Verde | 0.0 /100 | #315 | Tragic 29.2% |
| Sioux | 0.0 /100 | #316 | Tragic 29.1% |
| Colville | 0.0 /100 | #317 | Tragic 29.0% |
| Yaqui | 0.0 /100 | #318 | Tragic 29.0% |
Demographics Similar to Immigrants from Somalia by Bachelor's Degree
In terms of bachelor's degree, the demographic groups most similar to Immigrants from Somalia are Immigrants from Iraq (37.9%, a difference of 0.020%), Bermudan (38.0%, a difference of 0.14%), Czech (38.0%, a difference of 0.15%), Ghanaian (38.0%, a difference of 0.25%), and Immigrants from Bangladesh (37.8%, a difference of 0.27%).
| Demographics | Rating | Rank | Bachelor's Degree |
| Sri Lankans | 59.1 /100 | #165 | Average 38.2% |
| Somalis | 58.6 /100 | #166 | Average 38.1% |
| Scottish | 56.6 /100 | #167 | Average 38.1% |
| Danes | 56.2 /100 | #168 | Average 38.1% |
| Ghanaians | 55.3 /100 | #169 | Average 38.0% |
| Czechs | 54.4 /100 | #170 | Average 38.0% |
| Bermudans | 54.2 /100 | #171 | Average 38.0% |
| Immigrants | Somalia | 52.8 /100 | #172 | Average 37.9% |
| Immigrants | Iraq | 52.5 /100 | #173 | Average 37.9% |
| Immigrants | Bangladesh | 50.0 /100 | #174 | Average 37.8% |
| Immigrants | Uruguay | 48.3 /100 | #175 | Average 37.8% |
| Costa Ricans | 47.6 /100 | #176 | Average 37.7% |
| Basques | 47.4 /100 | #177 | Average 37.7% |
| Immigrants | Cameroon | 46.8 /100 | #178 | Average 37.7% |
| Immigrants | Colombia | 45.4 /100 | #179 | Average 37.7% |