Choctaw vs Immigrants from Afghanistan 9th Grade

COMPARE

Choctaw
Race
Ancestry
AfghanAfricanAlaska NativeAlaskan AthabascanAlbanianAleutAlsatianAmericanApacheArabArapahoArgentineanArmenianAssyrian/Chaldean/SyriacAustralianAustrianBahamianBangladeshiBarbadianBasqueBelgianBelizeanBermudanBhutaneseBlackfeetBolivianBrazilianBritishBritish West IndianBulgarianBurmeseCajunCambodianCanadianCape VerdeanCarpatho RusynCelticCentral AmericanCentral American IndianCherokeeCheyenneChickasawChileanChineseChippewaChoctawColombianColvilleComancheCosta RicanCreeCreekCroatianCrowCubanCypriotCzechCzechoslovakianDanishDelawareDominicanDutchDutch West IndianEastern EuropeanEcuadorianEgyptianEnglishEstonianEthiopianEuropeanFijianFilipinoFinnishFrenchFrench American IndianFrench CanadianGermanGerman RussianGhanaianGreekGuamanian/ChamorroGuatemalanGuyaneseHaitianHmongHonduranHopiHoumaHungarianIcelanderIndian (Asian)IndonesianInupiatIranianIraqiIrishIroquoisIsraeliItalianJamaicanJapaneseJordanianKenyanKiowaKoreanLaotianLatvianLebaneseLiberianLithuanianLumbeeLuxembourgerMacedonianMalaysianMalteseMarshalleseMenomineeMexicanMexican American IndianMongolianMoroccanNative HawaiianNavajoNepaleseNew ZealanderNicaraguanNigerianNorthern EuropeanNorwegianOkinawanOsageOttawaPaiutePakistaniPalestinianPanamanianParaguayanPennsylvania GermanPeruvianPimaPolishPortuguesePotawatomiPuebloPuerto RicanPuget Sound SalishRomanianRussianSalvadoranSamoanScandinavianScotch-IrishScottishSeminoleSenegaleseSerbianShoshoneSierra LeoneanSiouxSlavicSlovakSloveneSomaliSouth AfricanSouth AmericanSouth American IndianSoviet UnionSpaniardSpanishSpanish AmericanSpanish American IndianSri LankanSubsaharan AfricanSudaneseSwedishSwissSyrianTaiwaneseThaiTlingit-HaidaTohono O'OdhamTonganTrinidadian and TobagonianTsimshianTurkishU.S. Virgin IslanderUgandanUkrainianUruguayanUteVenezuelanVietnameseWelshWest IndianYakamaYaquiYugoslavianYumanYup'ikZimbabwean
Immigration
NonimmigrantsImmigrantsAfricaAlbaniaArgentinaArmeniaAsiaAustraliaAustriaBahamasBangladeshBarbadosBelarusBelgiumBelizeBoliviaBosnia and HerzegovinaBrazilBulgariaBurma/MyanmarCabo VerdeCambodiaCameroonCanadaCaribbeanCentral AmericaChileChinaColombiaCongoCosta RicaCroatiaCubaCzechoslovakiaDenmarkDominicaDominican RepublicEastern AfricaEastern AsiaEastern EuropeEcuadorEgyptEl SalvadorEnglandEritreaEthiopiaEuropeFijiFranceGermanyGhanaGreeceGrenadaGuatemalaGuyanaHaitiHondurasHong KongHungaryIndiaIndonesiaIranIraqIrelandIsraelItalyJamaicaJapanJordanKazakhstanKenyaKoreaKuwaitLaosLatin AmericaLatviaLebanonLiberiaLithuaniaMalaysiaMexicoMicronesiaMiddle AfricaMoldovaMoroccoNepalNetherlandsNicaraguaNigeriaNorth AmericaNorth MacedoniaNorthern AfricaNorthern EuropeNorwayOceaniaPakistanPanamaPeruPhilippinesPolandPortugalRomaniaRussiaSaudi ArabiaScotlandSenegalSerbiaSierra LeoneSingaporeSomaliaSouth AfricaSouth AmericaSouth Central AsiaSouth Eastern AsiaSouthern EuropeSpainSri LankaSt. Vincent and the GrenadinesSudanSwedenSwitzerlandSyriaTaiwanThailandTrinidad and TobagoTurkeyUgandaUkraineUruguayUzbekistanVenezuelaVietnamWest IndiesWestern AfricaWestern AsiaWestern EuropeYemenZaireZimbabweAzores
Immigrants from Afghanistan
Race
Ancestry
AfghanAfricanAlaska NativeAlaskan AthabascanAlbanianAleutAlsatianAmericanApacheArabArapahoArgentineanArmenianAssyrian/Chaldean/SyriacAustralianAustrianBahamianBangladeshiBarbadianBasqueBelgianBelizeanBermudanBhutaneseBlackfeetBolivianBrazilianBritishBritish West IndianBulgarianBurmeseCajunCambodianCanadianCape VerdeanCarpatho RusynCelticCentral AmericanCentral American IndianCherokeeCheyenneChickasawChileanChineseChippewaColombianColvilleComancheCosta RicanCreeCreekCroatianCrowCubanCypriotCzechCzechoslovakianDanishDelawareDominicanDutchDutch West IndianEastern EuropeanEcuadorianEgyptianEnglishEstonianEthiopianEuropeanFijianFilipinoFinnishFrenchFrench American IndianFrench CanadianGermanGerman RussianGhanaianGreekGuamanian/ChamorroGuatemalanGuyaneseHaitianHmongHonduranHopiHoumaHungarianIcelanderIndian (Asian)IndonesianInupiatIranianIraqiIrishIroquoisIsraeliItalianJamaicanJapaneseJordanianKenyanKiowaKoreanLaotianLatvianLebaneseLiberianLithuanianLumbeeLuxembourgerMacedonianMalaysianMalteseMarshalleseMenomineeMexicanMexican American IndianMongolianMoroccanNative HawaiianNavajoNepaleseNew ZealanderNicaraguanNigerianNorthern EuropeanNorwegianOkinawanOsageOttawaPaiutePakistaniPalestinianPanamanianParaguayanPennsylvania GermanPeruvianPimaPolishPortuguesePotawatomiPuebloPuerto RicanPuget Sound SalishRomanianRussianSalvadoranSamoanScandinavianScotch-IrishScottishSeminoleSenegaleseSerbianShoshoneSierra LeoneanSiouxSlavicSlovakSloveneSomaliSouth AfricanSouth AmericanSouth American IndianSoviet UnionSpaniardSpanishSpanish AmericanSpanish American IndianSri LankanSubsaharan AfricanSudaneseSwedishSwissSyrianTaiwaneseThaiTlingit-HaidaTohono O'OdhamTonganTrinidadian and TobagonianTsimshianTurkishU.S. Virgin IslanderUgandanUkrainianUruguayanUteVenezuelanVietnameseWelshWest IndianYakamaYaquiYugoslavianYumanYup'ikZimbabwean
Immigration
NonimmigrantsImmigrantsAfghanistanAfricaAlbaniaArgentinaArmeniaAsiaAustraliaAustriaBahamasBangladeshBarbadosBelarusBelgiumBelizeBoliviaBosnia and HerzegovinaBrazilBulgariaBurma/MyanmarCabo VerdeCambodiaCameroonCanadaCaribbeanCentral AmericaChileChinaColombiaCongoCosta RicaCroatiaCubaCzechoslovakiaDenmarkDominicaDominican RepublicEastern AfricaEastern AsiaEastern EuropeEcuadorEgyptEl SalvadorEnglandEritreaEthiopiaEuropeFijiFranceGermanyGhanaGreeceGrenadaGuatemalaGuyanaHaitiHondurasHong KongHungaryIndiaIndonesiaIranIraqIrelandIsraelItalyJamaicaJapanJordanKazakhstanKenyaKoreaKuwaitLaosLatin AmericaLatviaLebanonLiberiaLithuaniaMalaysiaMexicoMicronesiaMiddle AfricaMoldovaMoroccoNepalNetherlandsNicaraguaNigeriaNorth AmericaNorth MacedoniaNorthern AfricaNorthern EuropeNorwayOceaniaPakistanPanamaPeruPhilippinesPolandPortugalRomaniaRussiaSaudi ArabiaScotlandSenegalSerbiaSierra LeoneSingaporeSomaliaSouth AfricaSouth AmericaSouth Central AsiaSouth Eastern AsiaSouthern EuropeSpainSri LankaSt. Vincent and the GrenadinesSudanSwedenSwitzerlandSyriaTaiwanThailandTrinidad and TobagoTurkeyUgandaUkraineUruguayUzbekistanVenezuelaVietnamWest IndiesWestern AfricaWestern AsiaWestern EuropeYemenZaireZimbabweAzores
9th Grade
Income
Poverty
Unemployment
Labor Participation
Family Structure
Vehicle Availability
Education Level
Disability

9th Grade Comparison

Choctaw

Immigrants from Afghanistan

Excellent
Tragic
95.1%
9TH GRADE
81.9/ 100
METRIC RATING
147th/ 347
METRIC RANK
94.0%
9TH GRADE
0.5/ 100
METRIC RATING
256th/ 347
METRIC RANK

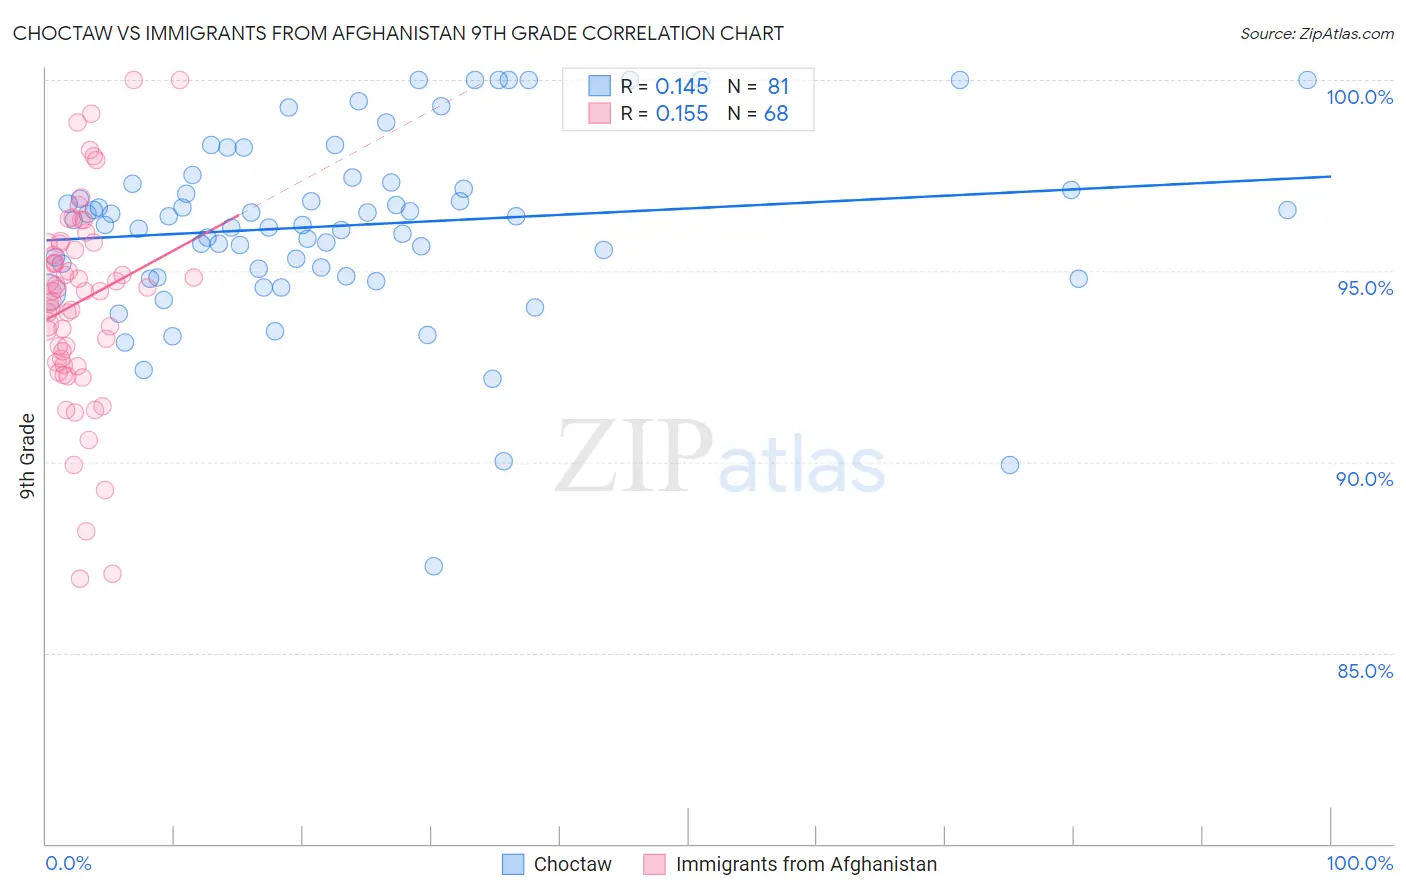
Choctaw vs Immigrants from Afghanistan 9th Grade Correlation Chart

The statistical analysis conducted on geographies consisting of 269,742,875 people shows a poor positive correlation between the proportion of Choctaw and percentage of population with at least 9th grade education in the United States with a correlation coefficient (R) of 0.145 and weighted average of 95.1%. Similarly, the statistical analysis conducted on geographies consisting of 147,629,924 people shows a poor positive correlation between the proportion of Immigrants from Afghanistan and percentage of population with at least 9th grade education in the United States with a correlation coefficient (R) of 0.155 and weighted average of 94.0%, a difference of 1.3%.
Choctaw vs Immigrants from Afghanistan 9th Grade

9th Grade Correlation Summary

MeasurementChoctawImmigrants from Afghanistan
Minimum87.3%86.9%
Maximum100.0%100.0%
Range12.7%13.1%
Mean96.2%94.2%
Median96.3%94.5%
Interquartile 25% (IQ1)95.0%92.7%
Interquartile 75% (IQ3)97.3%95.7%
Interquartile Range (IQR)2.3%3.1%
Standard Deviation (Sample)2.4%2.7%
Standard Deviation (Population)2.4%2.6%

Similar Demographics by 9th Grade

Demographics Similar to Choctaw by 9th Grade

In terms of 9th grade, the demographic groups most similar to Choctaw are Pueblo (95.1%, a difference of 0.0%), Immigrants from Sri Lanka (95.1%, a difference of 0.0%), Immigrants from Jordan (95.1%, a difference of 0.010%), Yup'ik (95.2%, a difference of 0.020%), and Spanish (95.2%, a difference of 0.030%).
DemographicsRating | Rank9th Grade
Immigrants | Taiwan
85.3
/100
|
#140
Excellent
95.2%
Immigrants | Bosnia and Herzegovina
85.2
/100
|
#141
Excellent
95.2%
Immigrants | Greece
84.6
/100
|
#142
Excellent
95.2%
Spanish
84.4
/100
|
#143
Excellent
95.2%
Yup'ik
83.3
/100
|
#144
Excellent
95.2%
Pueblo
82.2
/100
|
#145
Excellent
95.1%
Immigrants | Sri Lanka
82.1
/100
|
#146
Excellent
95.1%
Choctaw
81.9
/100
|
#147
Excellent
95.1%
Immigrants | Jordan
81.2
/100
|
#148
Excellent
95.1%
Immigrants | Korea
79.6
/100
|
#149
Good
95.1%
Kenyans
79.1
/100
|
#150
Good
95.1%
Cajuns
77.3
/100
|
#151
Good
95.1%
Ugandans
77.0
/100
|
#152
Good
95.1%
Albanians
76.1
/100
|
#153
Good
95.1%
Arabs
74.9
/100
|
#154
Good
95.1%

Demographics Similar to Immigrants from Afghanistan by 9th Grade

In terms of 9th grade, the demographic groups most similar to Immigrants from Afghanistan are Immigrants from Nigeria (94.0%, a difference of 0.010%), Immigrants from Costa Rica (94.0%, a difference of 0.020%), Immigrants from Thailand (93.9%, a difference of 0.020%), Ghanaian (93.9%, a difference of 0.020%), and Pima (93.9%, a difference of 0.040%).
DemographicsRating | Rank9th Grade
Uruguayans
1.3
/100
|
#249
Tragic
94.1%
Immigrants | Hong Kong
1.3
/100
|
#250
Tragic
94.1%
Jamaicans
1.0
/100
|
#251
Tragic
94.1%
Immigrants | Senegal
0.9
/100
|
#252
Tragic
94.1%
Colombians
0.8
/100
|
#253
Tragic
94.0%
U.S. Virgin Islanders
0.7
/100
|
#254
Tragic
94.0%
Immigrants | Nigeria
0.6
/100
|
#255
Tragic
94.0%
Immigrants | Afghanistan
0.5
/100
|
#256
Tragic
94.0%
Immigrants | Costa Rica
0.5
/100
|
#257
Tragic
94.0%
Immigrants | Thailand
0.5
/100
|
#258
Tragic
93.9%
Ghanaians
0.5
/100
|
#259
Tragic
93.9%
Pima
0.4
/100
|
#260
Tragic
93.9%
South Americans
0.4
/100
|
#261
Tragic
93.9%
Immigrants | Jamaica
0.4
/100
|
#262
Tragic
93.9%
Immigrants | Uzbekistan
0.4
/100
|
#263
Tragic
93.9%