Choctaw vs Ecuadorian 11th Grade

COMPARE

Choctaw
Race
Ancestry
AfghanAfricanAlaska NativeAlaskan AthabascanAlbanianAleutAlsatianAmericanApacheArabArapahoArgentineanArmenianAssyrian/Chaldean/SyriacAustralianAustrianBahamianBangladeshiBarbadianBasqueBelgianBelizeanBermudanBhutaneseBlackfeetBolivianBrazilianBritishBritish West IndianBulgarianBurmeseCajunCambodianCanadianCape VerdeanCarpatho RusynCelticCentral AmericanCentral American IndianCherokeeCheyenneChickasawChileanChineseChippewaChoctawColombianColvilleComancheCosta RicanCreeCreekCroatianCrowCubanCypriotCzechCzechoslovakianDanishDelawareDominicanDutchDutch West IndianEastern EuropeanEgyptianEnglishEstonianEthiopianEuropeanFijianFilipinoFinnishFrenchFrench American IndianFrench CanadianGermanGerman RussianGhanaianGreekGuamanian/ChamorroGuatemalanGuyaneseHaitianHmongHonduranHopiHoumaHungarianIcelanderIndian (Asian)IndonesianInupiatIranianIraqiIrishIroquoisIsraeliItalianJamaicanJapaneseJordanianKenyanKiowaKoreanLaotianLatvianLebaneseLiberianLithuanianLumbeeLuxembourgerMacedonianMalaysianMalteseMarshalleseMenomineeMexicanMexican American IndianMongolianMoroccanNative HawaiianNavajoNepaleseNew ZealanderNicaraguanNigerianNorthern EuropeanNorwegianOkinawanOsageOttawaPaiutePakistaniPalestinianPanamanianParaguayanPennsylvania GermanPeruvianPimaPolishPortuguesePotawatomiPuebloPuerto RicanPuget Sound SalishRomanianRussianSalvadoranSamoanScandinavianScotch-IrishScottishSeminoleSenegaleseSerbianShoshoneSierra LeoneanSiouxSlavicSlovakSloveneSomaliSouth AfricanSouth AmericanSouth American IndianSoviet UnionSpaniardSpanishSpanish AmericanSpanish American IndianSri LankanSubsaharan AfricanSudaneseSwedishSwissSyrianTaiwaneseThaiTlingit-HaidaTohono O'OdhamTonganTrinidadian and TobagonianTsimshianTurkishU.S. Virgin IslanderUgandanUkrainianUruguayanUteVenezuelanVietnameseWelshWest IndianYakamaYaquiYugoslavianYumanYup'ikZimbabwean
Immigration
NonimmigrantsImmigrantsAfghanistanAfricaAlbaniaArgentinaArmeniaAsiaAustraliaAustriaBahamasBangladeshBarbadosBelarusBelgiumBelizeBoliviaBosnia and HerzegovinaBrazilBulgariaBurma/MyanmarCabo VerdeCambodiaCameroonCanadaCaribbeanCentral AmericaChileChinaColombiaCongoCosta RicaCroatiaCubaCzechoslovakiaDenmarkDominicaDominican RepublicEastern AfricaEastern AsiaEastern EuropeEcuadorEgyptEl SalvadorEnglandEritreaEthiopiaEuropeFijiFranceGermanyGhanaGreeceGrenadaGuatemalaGuyanaHaitiHondurasHong KongHungaryIndiaIndonesiaIranIraqIrelandIsraelItalyJamaicaJapanJordanKazakhstanKenyaKoreaKuwaitLaosLatin AmericaLatviaLebanonLiberiaLithuaniaMalaysiaMexicoMicronesiaMiddle AfricaMoldovaMoroccoNepalNetherlandsNicaraguaNigeriaNorth AmericaNorth MacedoniaNorthern AfricaNorthern EuropeNorwayOceaniaPakistanPanamaPeruPhilippinesPolandPortugalRomaniaRussiaSaudi ArabiaScotlandSenegalSerbiaSierra LeoneSingaporeSomaliaSouth AfricaSouth AmericaSouth Central AsiaSouth Eastern AsiaSouthern EuropeSpainSri LankaSt. Vincent and the GrenadinesSudanSwedenSwitzerlandSyriaTaiwanThailandTrinidad and TobagoTurkeyUgandaUkraineUruguayUzbekistanVenezuelaVietnamWest IndiesWestern AfricaWestern AsiaWestern EuropeYemenZaireZimbabweAzores
Ecuadorian
Race
Ancestry
AfghanAfricanAlaska NativeAlaskan AthabascanAlbanianAleutAlsatianAmericanApacheArabArapahoArgentineanArmenianAssyrian/Chaldean/SyriacAustralianAustrianBahamianBangladeshiBarbadianBasqueBelgianBelizeanBermudanBhutaneseBlackfeetBolivianBrazilianBritishBritish West IndianBulgarianBurmeseCajunCambodianCanadianCape VerdeanCarpatho RusynCelticCentral AmericanCentral American IndianCherokeeCheyenneChickasawChileanChineseChippewaColombianColvilleComancheCosta RicanCreeCreekCroatianCrowCubanCypriotCzechCzechoslovakianDanishDelawareDominicanDutchDutch West IndianEastern EuropeanEcuadorianEgyptianEnglishEstonianEthiopianEuropeanFijianFilipinoFinnishFrenchFrench American IndianFrench CanadianGermanGerman RussianGhanaianGreekGuamanian/ChamorroGuatemalanGuyaneseHaitianHmongHonduranHopiHoumaHungarianIcelanderIndian (Asian)IndonesianInupiatIranianIraqiIrishIroquoisIsraeliItalianJamaicanJapaneseJordanianKenyanKiowaKoreanLaotianLatvianLebaneseLiberianLithuanianLumbeeLuxembourgerMacedonianMalaysianMalteseMarshalleseMenomineeMexicanMexican American IndianMongolianMoroccanNative HawaiianNavajoNepaleseNew ZealanderNicaraguanNigerianNorthern EuropeanNorwegianOkinawanOsageOttawaPaiutePakistaniPalestinianPanamanianParaguayanPennsylvania GermanPeruvianPimaPolishPortuguesePotawatomiPuebloPuerto RicanPuget Sound SalishRomanianRussianSalvadoranSamoanScandinavianScotch-IrishScottishSeminoleSenegaleseSerbianShoshoneSierra LeoneanSiouxSlavicSlovakSloveneSomaliSouth AfricanSouth AmericanSouth American IndianSoviet UnionSpaniardSpanishSpanish AmericanSpanish American IndianSri LankanSubsaharan AfricanSudaneseSwedishSwissSyrianTaiwaneseThaiTlingit-HaidaTohono O'OdhamTonganTrinidadian and TobagonianTsimshianTurkishU.S. Virgin IslanderUgandanUkrainianUruguayanUteVenezuelanVietnameseWelshWest IndianYakamaYaquiYugoslavianYumanYup'ikZimbabwean
Immigration
NonimmigrantsImmigrantsAfghanistanAfricaAlbaniaArgentinaArmeniaAsiaAustraliaAustriaBahamasBangladeshBarbadosBelarusBelgiumBelizeBoliviaBosnia and HerzegovinaBrazilBulgariaBurma/MyanmarCabo VerdeCambodiaCameroonCanadaCaribbeanCentral AmericaChileChinaColombiaCongoCosta RicaCroatiaCubaCzechoslovakiaDenmarkDominicaDominican RepublicEastern AfricaEastern AsiaEastern EuropeEcuadorEgyptEl SalvadorEnglandEritreaEthiopiaEuropeFijiFranceGermanyGhanaGreeceGrenadaGuatemalaGuyanaHaitiHondurasHong KongHungaryIndiaIndonesiaIranIraqIrelandIsraelItalyJamaicaJapanJordanKazakhstanKenyaKoreaKuwaitLaosLatin AmericaLatviaLebanonLiberiaLithuaniaMalaysiaMexicoMicronesiaMiddle AfricaMoldovaMoroccoNepalNetherlandsNicaraguaNigeriaNorth AmericaNorth MacedoniaNorthern AfricaNorthern EuropeNorwayOceaniaPakistanPanamaPeruPhilippinesPolandPortugalRomaniaRussiaSaudi ArabiaScotlandSenegalSerbiaSierra LeoneSingaporeSomaliaSouth AfricaSouth AmericaSouth Central AsiaSouth Eastern AsiaSouthern EuropeSpainSri LankaSt. Vincent and the GrenadinesSudanSwedenSwitzerlandSyriaTaiwanThailandTrinidad and TobagoTurkeyUgandaUkraineUruguayUzbekistanVenezuelaVietnamWest IndiesWestern AfricaWestern AsiaWestern EuropeYemenZaireZimbabweAzores
11th Grade
Income
Poverty
Unemployment
Labor Participation
Family Structure
Vehicle Availability
Education Level
Disability

11th Grade Comparison

Choctaw

Ecuadorians

Tragic
Tragic
91.8%
11TH GRADE
3.7/ 100
METRIC RATING
231st/ 347
METRIC RANK
89.6%
11TH GRADE
0.0/ 100
METRIC RATING
306th/ 347
METRIC RANK

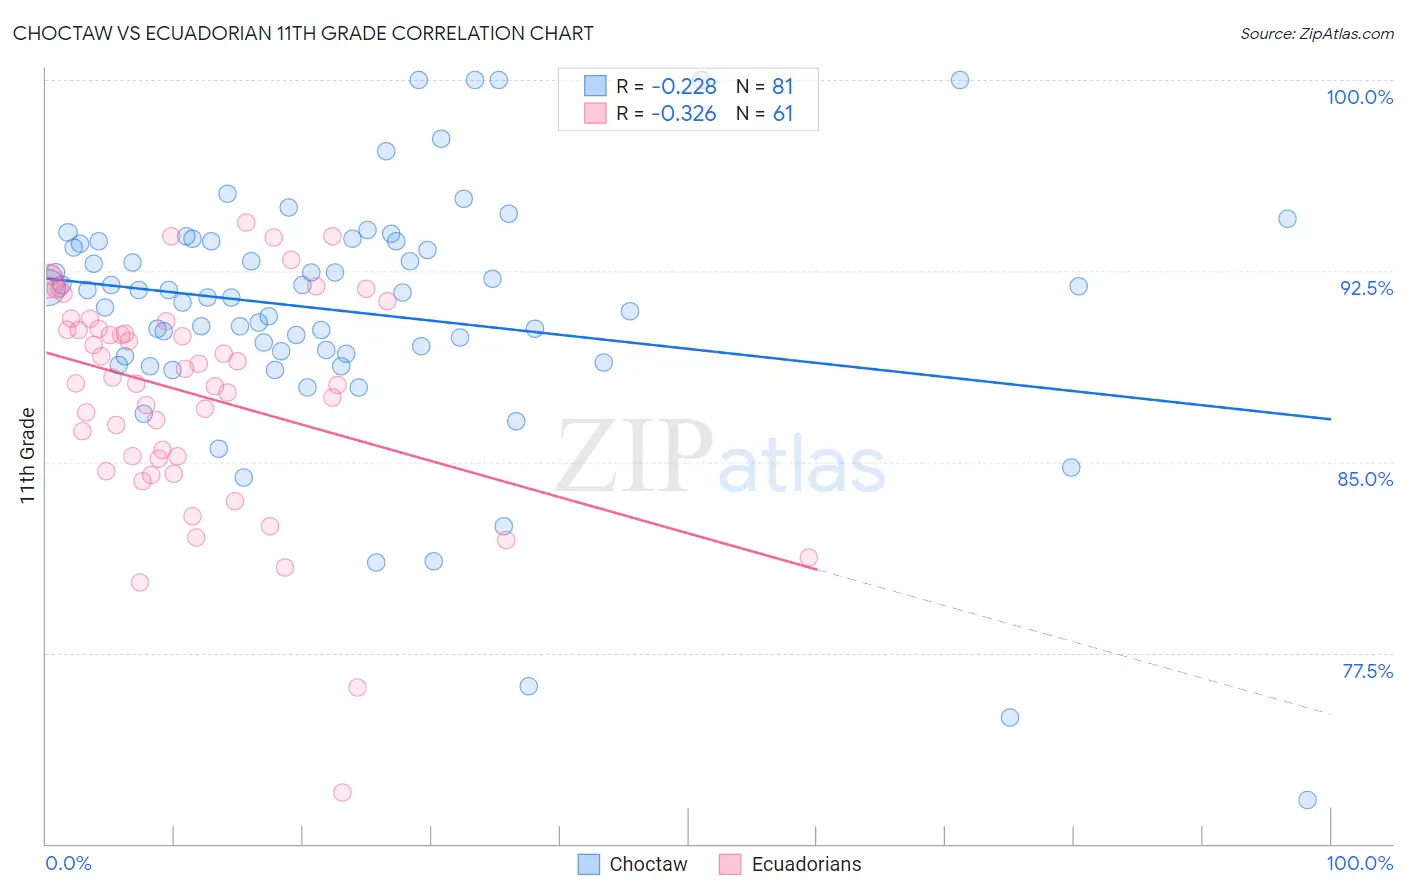
Choctaw vs Ecuadorian 11th Grade Correlation Chart

The statistical analysis conducted on geographies consisting of 269,742,875 people shows a weak negative correlation between the proportion of Choctaw and percentage of population with at least 11th grade education in the United States with a correlation coefficient (R) of -0.228 and weighted average of 91.8%. Similarly, the statistical analysis conducted on geographies consisting of 317,753,005 people shows a mild negative correlation between the proportion of Ecuadorians and percentage of population with at least 11th grade education in the United States with a correlation coefficient (R) of -0.326 and weighted average of 89.6%, a difference of 2.5%.
Choctaw vs Ecuadorian 11th Grade

11th Grade Correlation Summary

MeasurementChoctawEcuadorian
Minimum71.7%72.0%
Maximum100.0%94.4%
Range28.3%22.4%
Mean90.9%87.7%
Median91.7%88.3%
Interquartile 25% (IQ1)89.2%85.2%
Interquartile 75% (IQ3)93.7%90.6%
Interquartile Range (IQR)4.5%5.4%
Standard Deviation (Sample)5.0%4.3%
Standard Deviation (Population)5.0%4.3%

Similar Demographics by 11th Grade

Demographics Similar to Choctaw by 11th Grade

In terms of 11th grade, the demographic groups most similar to Choctaw are Immigrants from Afghanistan (91.8%, a difference of 0.010%), Uruguayan (91.8%, a difference of 0.020%), Cheyenne (91.8%, a difference of 0.030%), Immigrants from Cameroon (91.8%, a difference of 0.040%), and Immigrants from Panama (91.8%, a difference of 0.040%).
DemographicsRating | Rank11th Grade
Costa Ricans
6.3
/100
|
#224
Tragic
91.9%
Immigrants | Zaire
5.4
/100
|
#225
Tragic
91.9%
Immigrants | Somalia
5.2
/100
|
#226
Tragic
91.9%
Immigrants | Cameroon
4.4
/100
|
#227
Tragic
91.8%
Immigrants | Panama
4.3
/100
|
#228
Tragic
91.8%
Nigerians
4.3
/100
|
#229
Tragic
91.8%
Immigrants | Afghanistan
3.9
/100
|
#230
Tragic
91.8%
Choctaw
3.7
/100
|
#231
Tragic
91.8%
Uruguayans
3.5
/100
|
#232
Tragic
91.8%
Cheyenne
3.3
/100
|
#233
Tragic
91.8%
Armenians
2.9
/100
|
#234
Tragic
91.7%
Sub-Saharan Africans
2.9
/100
|
#235
Tragic
91.7%
Colombians
2.8
/100
|
#236
Tragic
91.7%
Immigrants | Bolivia
2.8
/100
|
#237
Tragic
91.7%
Comanche
2.6
/100
|
#238
Tragic
91.7%

Demographics Similar to Ecuadorians by 11th Grade

In terms of 11th grade, the demographic groups most similar to Ecuadorians are Immigrants from Cambodia (89.6%, a difference of 0.050%), Immigrants from Dominica (89.5%, a difference of 0.050%), Nepalese (89.5%, a difference of 0.070%), Immigrants from Bangladesh (89.5%, a difference of 0.10%), and Yaqui (89.5%, a difference of 0.11%).
DemographicsRating | Rank11th Grade
Japanese
0.0
/100
|
#299
Tragic
89.9%
Immigrants | Haiti
0.0
/100
|
#300
Tragic
89.9%
Guyanese
0.0
/100
|
#301
Tragic
89.9%
Immigrants | Guyana
0.0
/100
|
#302
Tragic
89.7%
Immigrants | Immigrants
0.0
/100
|
#303
Tragic
89.7%
Yuman
0.0
/100
|
#304
Tragic
89.7%
Immigrants | Cambodia
0.0
/100
|
#305
Tragic
89.6%
Ecuadorians
0.0
/100
|
#306
Tragic
89.6%
Immigrants | Dominica
0.0
/100
|
#307
Tragic
89.5%
Nepalese
0.0
/100
|
#308
Tragic
89.5%
Immigrants | Bangladesh
0.0
/100
|
#309
Tragic
89.5%
Yaqui
0.0
/100
|
#310
Tragic
89.5%
Vietnamese
0.0
/100
|
#311
Tragic
89.4%
Immigrants | Portugal
0.0
/100
|
#312
Tragic
89.3%
Immigrants | Caribbean
0.0
/100
|
#313
Tragic
89.1%