Chippewa vs Swedish 10th Grade
COMPARE
Chippewa
Swedish
10th Grade
10th Grade Comparison
Chippewa
Swedes
95.0%
10TH GRADE
99.8/ 100
METRIC RATING
61st/ 347
METRIC RANK
95.9%
10TH GRADE
100.0/ 100
METRIC RATING
4th/ 347
METRIC RANK
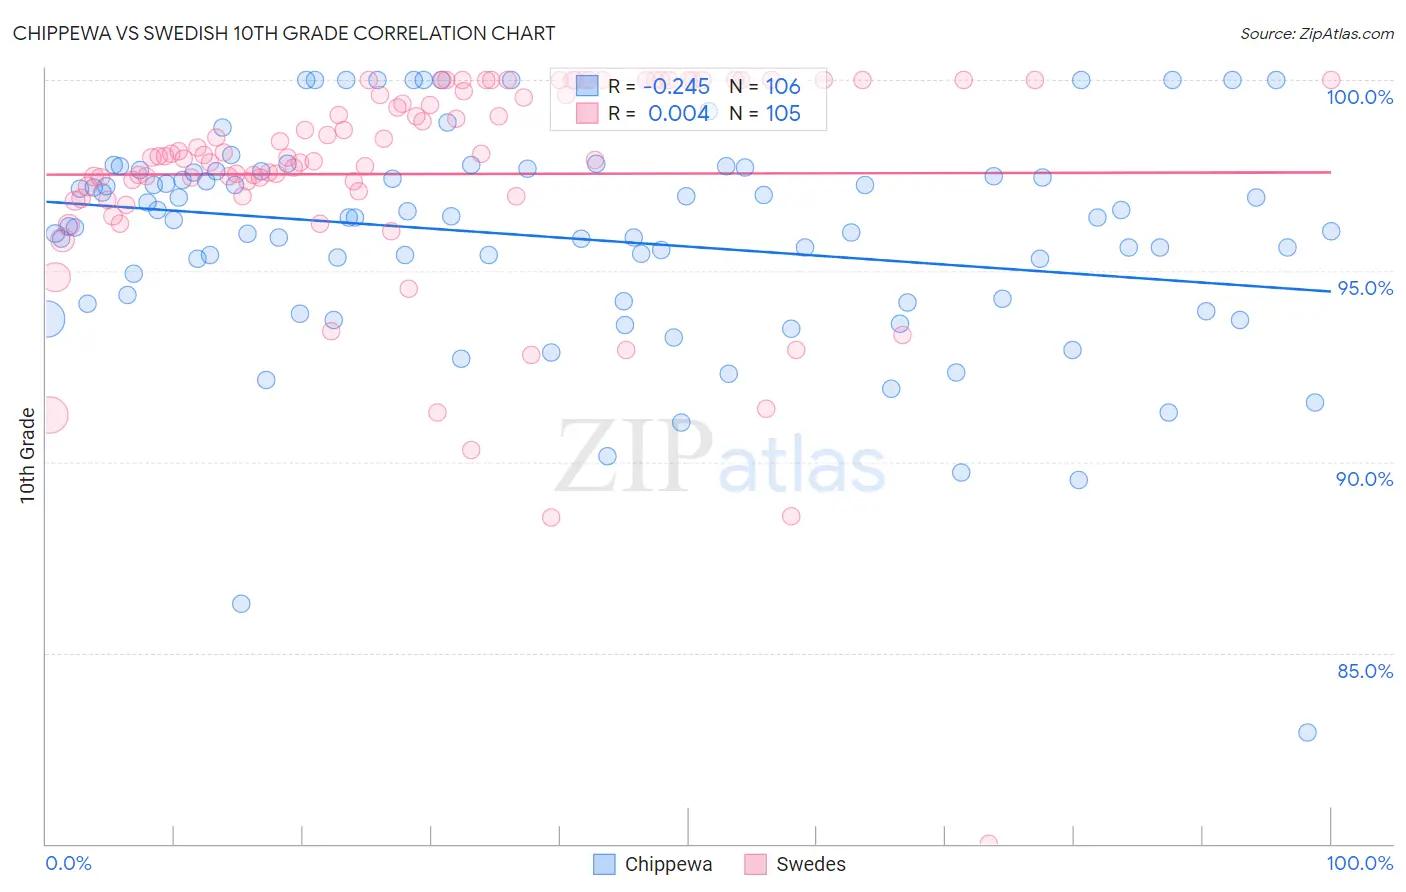
Chippewa vs Swedish 10th Grade Correlation Chart
The statistical analysis conducted on geographies consisting of 215,067,289 people shows a weak negative correlation between the proportion of Chippewa and percentage of population with at least 10th grade education in the United States with a correlation coefficient (R) of -0.245 and weighted average of 95.0%. Similarly, the statistical analysis conducted on geographies consisting of 539,231,897 people shows no correlation between the proportion of Swedes and percentage of population with at least 10th grade education in the United States with a correlation coefficient (R) of 0.004 and weighted average of 95.9%, a difference of 1.0%.
10th Grade Correlation Summary
| Measurement | Chippewa | Swedish |
| Minimum | 82.9% | 80.0% |
| Maximum | 100.0% | 100.0% |
| Range | 17.1% | 20.0% |
| Mean | 95.9% | 97.5% |
| Median | 96.4% | 98.0% |
| Interquartile 25% (IQ1) | 94.2% | 97.0% |
| Interquartile 75% (IQ3) | 97.6% | 100.0% |
| Interquartile Range (IQR) | 3.4% | 3.0% |
| Standard Deviation (Sample) | 2.9% | 3.1% |
| Standard Deviation (Population) | 2.9% | 3.1% |
Similar Demographics by 10th Grade
Demographics Similar to Chippewa by 10th Grade
In terms of 10th grade, the demographic groups most similar to Chippewa are Cypriot (95.0%, a difference of 0.0%), Aleut (95.0%, a difference of 0.010%), Celtic (95.0%, a difference of 0.010%), Thai (95.0%, a difference of 0.010%), and Immigrants from Singapore (95.0%, a difference of 0.010%).
| Demographics | Rating | Rank | 10th Grade |
| Immigrants | Lithuania | 99.8 /100 | #54 | Exceptional 95.0% |
| Immigrants | Ireland | 99.8 /100 | #55 | Exceptional 95.0% |
| New Zealanders | 99.8 /100 | #56 | Exceptional 95.0% |
| Ukrainians | 99.8 /100 | #57 | Exceptional 95.0% |
| Aleuts | 99.8 /100 | #58 | Exceptional 95.0% |
| Celtics | 99.8 /100 | #59 | Exceptional 95.0% |
| Cypriots | 99.8 /100 | #60 | Exceptional 95.0% |
| Chippewa | 99.8 /100 | #61 | Exceptional 95.0% |
| Thais | 99.8 /100 | #62 | Exceptional 95.0% |
| Immigrants | Singapore | 99.8 /100 | #63 | Exceptional 95.0% |
| Native Hawaiians | 99.7 /100 | #64 | Exceptional 95.0% |
| Turks | 99.7 /100 | #65 | Exceptional 95.0% |
| Immigrants | Australia | 99.7 /100 | #66 | Exceptional 94.9% |
| Immigrants | Netherlands | 99.7 /100 | #67 | Exceptional 94.9% |
| Immigrants | Belgium | 99.7 /100 | #68 | Exceptional 94.9% |
Demographics Similar to Swedes by 10th Grade
In terms of 10th grade, the demographic groups most similar to Swedes are Slovene (95.9%, a difference of 0.0%), Carpatho Rusyn (95.9%, a difference of 0.020%), Slovak (96.0%, a difference of 0.10%), Polish (95.8%, a difference of 0.12%), and German (95.8%, a difference of 0.13%).
| Demographics | Rating | Rank | 10th Grade |
| Norwegians | 100.0 /100 | #1 | Exceptional 96.2% |
| Slovaks | 100.0 /100 | #2 | Exceptional 96.0% |
| Slovenes | 100.0 /100 | #3 | Exceptional 95.9% |
| Swedes | 100.0 /100 | #4 | Exceptional 95.9% |
| Carpatho Rusyns | 100.0 /100 | #5 | Exceptional 95.9% |
| Poles | 100.0 /100 | #6 | Exceptional 95.8% |
| Germans | 100.0 /100 | #7 | Exceptional 95.8% |
| Lithuanians | 100.0 /100 | #8 | Exceptional 95.8% |
| Finns | 100.0 /100 | #9 | Exceptional 95.8% |
| Croatians | 100.0 /100 | #10 | Exceptional 95.7% |
| Danes | 100.0 /100 | #11 | Exceptional 95.7% |
| Tlingit-Haida | 100.0 /100 | #12 | Exceptional 95.7% |
| English | 100.0 /100 | #13 | Exceptional 95.6% |
| Tsimshian | 100.0 /100 | #14 | Exceptional 95.6% |
| Irish | 100.0 /100 | #15 | Exceptional 95.6% |