Chippewa vs Immigrants from Trinidad and Tobago High School Diploma

COMPARE

Chippewa
Race
Ancestry
AfghanAfricanAlaska NativeAlaskan AthabascanAlbanianAleutAlsatianAmericanApacheArabArapahoArgentineanArmenianAssyrian/Chaldean/SyriacAustralianAustrianBahamianBangladeshiBarbadianBasqueBelgianBelizeanBermudanBhutaneseBlackfeetBolivianBrazilianBritishBritish West IndianBulgarianBurmeseCajunCambodianCanadianCape VerdeanCarpatho RusynCelticCentral AmericanCentral American IndianCherokeeCheyenneChickasawChileanChineseChippewaChoctawColombianColvilleComancheCosta RicanCreeCreekCroatianCrowCubanCypriotCzechCzechoslovakianDanishDelawareDominicanDutchDutch West IndianEastern EuropeanEcuadorianEgyptianEnglishEstonianEthiopianEuropeanFijianFilipinoFinnishFrenchFrench American IndianFrench CanadianGermanGerman RussianGhanaianGreekGuamanian/ChamorroGuatemalanGuyaneseHaitianHmongHonduranHopiHoumaHungarianIcelanderIndian (Asian)IndonesianInupiatIranianIraqiIrishIroquoisIsraeliItalianJamaicanJapaneseJordanianKenyanKiowaKoreanLaotianLatvianLebaneseLiberianLithuanianLumbeeLuxembourgerMacedonianMalaysianMalteseMarshalleseMenomineeMexicanMexican American IndianMongolianMoroccanNative HawaiianNavajoNepaleseNew ZealanderNicaraguanNigerianNorthern EuropeanNorwegianOkinawanOsageOttawaPaiutePakistaniPalestinianPanamanianParaguayanPennsylvania GermanPeruvianPimaPolishPortuguesePotawatomiPuebloPuerto RicanPuget Sound SalishRomanianRussianSalvadoranSamoanScandinavianScotch-IrishScottishSeminoleSenegaleseSerbianShoshoneSierra LeoneanSiouxSlavicSlovakSloveneSomaliSouth AfricanSouth AmericanSouth American IndianSoviet UnionSpaniardSpanishSpanish AmericanSpanish American IndianSri LankanSubsaharan AfricanSudaneseSwedishSwissSyrianTaiwaneseThaiTlingit-HaidaTohono O'OdhamTonganTrinidadian and TobagonianTsimshianTurkishU.S. Virgin IslanderUgandanUkrainianUruguayanUteVenezuelanVietnameseWelshWest IndianYakamaYaquiYugoslavianYumanYup'ikZimbabwean
Immigration
NonimmigrantsImmigrantsAfghanistanAfricaAlbaniaArgentinaArmeniaAsiaAustraliaAustriaBahamasBangladeshBarbadosBelarusBelgiumBelizeBoliviaBosnia and HerzegovinaBrazilBulgariaBurma/MyanmarCabo VerdeCambodiaCameroonCanadaCaribbeanCentral AmericaChileChinaColombiaCongoCosta RicaCroatiaCubaCzechoslovakiaDenmarkDominicaDominican RepublicEastern AfricaEastern AsiaEastern EuropeEcuadorEgyptEl SalvadorEnglandEritreaEthiopiaEuropeFijiFranceGermanyGhanaGreeceGrenadaGuatemalaGuyanaHaitiHondurasHong KongHungaryIndiaIndonesiaIranIraqIrelandIsraelItalyJamaicaJapanJordanKazakhstanKenyaKoreaKuwaitLaosLatin AmericaLatviaLebanonLiberiaLithuaniaMalaysiaMexicoMicronesiaMiddle AfricaMoldovaMoroccoNepalNetherlandsNicaraguaNigeriaNorth AmericaNorth MacedoniaNorthern AfricaNorthern EuropeNorwayOceaniaPakistanPanamaPeruPhilippinesPolandPortugalRomaniaRussiaSaudi ArabiaScotlandSenegalSerbiaSierra LeoneSingaporeSomaliaSouth AfricaSouth AmericaSouth Central AsiaSouth Eastern AsiaSouthern EuropeSpainSri LankaSt. Vincent and the GrenadinesSudanSwedenSwitzerlandSyriaTaiwanThailandTurkeyUgandaUkraineUruguayUzbekistanVenezuelaVietnamWest IndiesWestern AfricaWestern AsiaWestern EuropeYemenZaireZimbabweAzores
Immigrants from Trinidad and Tobago
Race
Ancestry
AfghanAfricanAlaska NativeAlaskan AthabascanAlbanianAleutAlsatianAmericanApacheArabArapahoArgentineanArmenianAssyrian/Chaldean/SyriacAustralianAustrianBahamianBangladeshiBarbadianBasqueBelgianBelizeanBermudanBhutaneseBlackfeetBolivianBrazilianBritishBritish West IndianBulgarianBurmeseCajunCambodianCanadianCape VerdeanCarpatho RusynCelticCentral AmericanCentral American IndianCherokeeCheyenneChickasawChileanChineseChoctawColombianColvilleComancheCosta RicanCreeCreekCroatianCrowCubanCypriotCzechCzechoslovakianDanishDelawareDominicanDutchDutch West IndianEastern EuropeanEcuadorianEgyptianEnglishEstonianEthiopianEuropeanFijianFilipinoFinnishFrenchFrench American IndianFrench CanadianGermanGerman RussianGhanaianGreekGuamanian/ChamorroGuatemalanGuyaneseHaitianHmongHonduranHopiHoumaHungarianIcelanderIndian (Asian)IndonesianInupiatIranianIraqiIrishIroquoisIsraeliItalianJamaicanJapaneseJordanianKenyanKiowaKoreanLaotianLatvianLebaneseLiberianLithuanianLumbeeLuxembourgerMacedonianMalaysianMalteseMarshalleseMenomineeMexicanMexican American IndianMongolianMoroccanNative HawaiianNavajoNepaleseNew ZealanderNicaraguanNigerianNorthern EuropeanNorwegianOkinawanOsageOttawaPaiutePakistaniPalestinianPanamanianParaguayanPennsylvania GermanPeruvianPimaPolishPortuguesePotawatomiPuebloPuerto RicanPuget Sound SalishRomanianRussianSalvadoranSamoanScandinavianScotch-IrishScottishSeminoleSenegaleseSerbianShoshoneSierra LeoneanSiouxSlavicSlovakSloveneSomaliSouth AfricanSouth AmericanSouth American IndianSoviet UnionSpaniardSpanishSpanish AmericanSpanish American IndianSri LankanSubsaharan AfricanSudaneseSwedishSwissSyrianTaiwaneseThaiTlingit-HaidaTohono O'OdhamTonganTrinidadian and TobagonianTsimshianTurkishU.S. Virgin IslanderUgandanUkrainianUruguayanUteVenezuelanVietnameseWelshWest IndianYakamaYaquiYugoslavianYumanYup'ikZimbabwean
Immigration
NonimmigrantsImmigrantsAfghanistanAfricaAlbaniaArgentinaArmeniaAsiaAustraliaAustriaBahamasBangladeshBarbadosBelarusBelgiumBelizeBoliviaBosnia and HerzegovinaBrazilBulgariaBurma/MyanmarCabo VerdeCambodiaCameroonCanadaCaribbeanCentral AmericaChileChinaColombiaCongoCosta RicaCroatiaCubaCzechoslovakiaDenmarkDominicaDominican RepublicEastern AfricaEastern AsiaEastern EuropeEcuadorEgyptEl SalvadorEnglandEritreaEthiopiaEuropeFijiFranceGermanyGhanaGreeceGrenadaGuatemalaGuyanaHaitiHondurasHong KongHungaryIndiaIndonesiaIranIraqIrelandIsraelItalyJamaicaJapanJordanKazakhstanKenyaKoreaKuwaitLaosLatin AmericaLatviaLebanonLiberiaLithuaniaMalaysiaMexicoMicronesiaMiddle AfricaMoldovaMoroccoNepalNetherlandsNicaraguaNigeriaNorth AmericaNorth MacedoniaNorthern AfricaNorthern EuropeNorwayOceaniaPakistanPanamaPeruPhilippinesPolandPortugalRomaniaRussiaSaudi ArabiaScotlandSenegalSerbiaSierra LeoneSingaporeSomaliaSouth AfricaSouth AmericaSouth Central AsiaSouth Eastern AsiaSouthern EuropeSpainSri LankaSt. Vincent and the GrenadinesSudanSwedenSwitzerlandSyriaTaiwanThailandTrinidad and TobagoTurkeyUgandaUkraineUruguayUzbekistanVenezuelaVietnamWest IndiesWestern AfricaWestern AsiaWestern EuropeYemenZaireZimbabweAzores
High School Diploma
Income
Poverty
Unemployment
Labor Participation
Family Structure
Vehicle Availability
Education Level
Disability

High School Diploma Comparison

Chippewa

Immigrants from Trinidad and Tobago

Excellent
Tragic
89.7%
HIGH SCHOOL DIPLOMA
85.6/ 100
METRIC RATING
135th/ 347
METRIC RANK
86.8%
HIGH SCHOOL DIPLOMA
0.1/ 100
METRIC RATING
275th/ 347
METRIC RANK

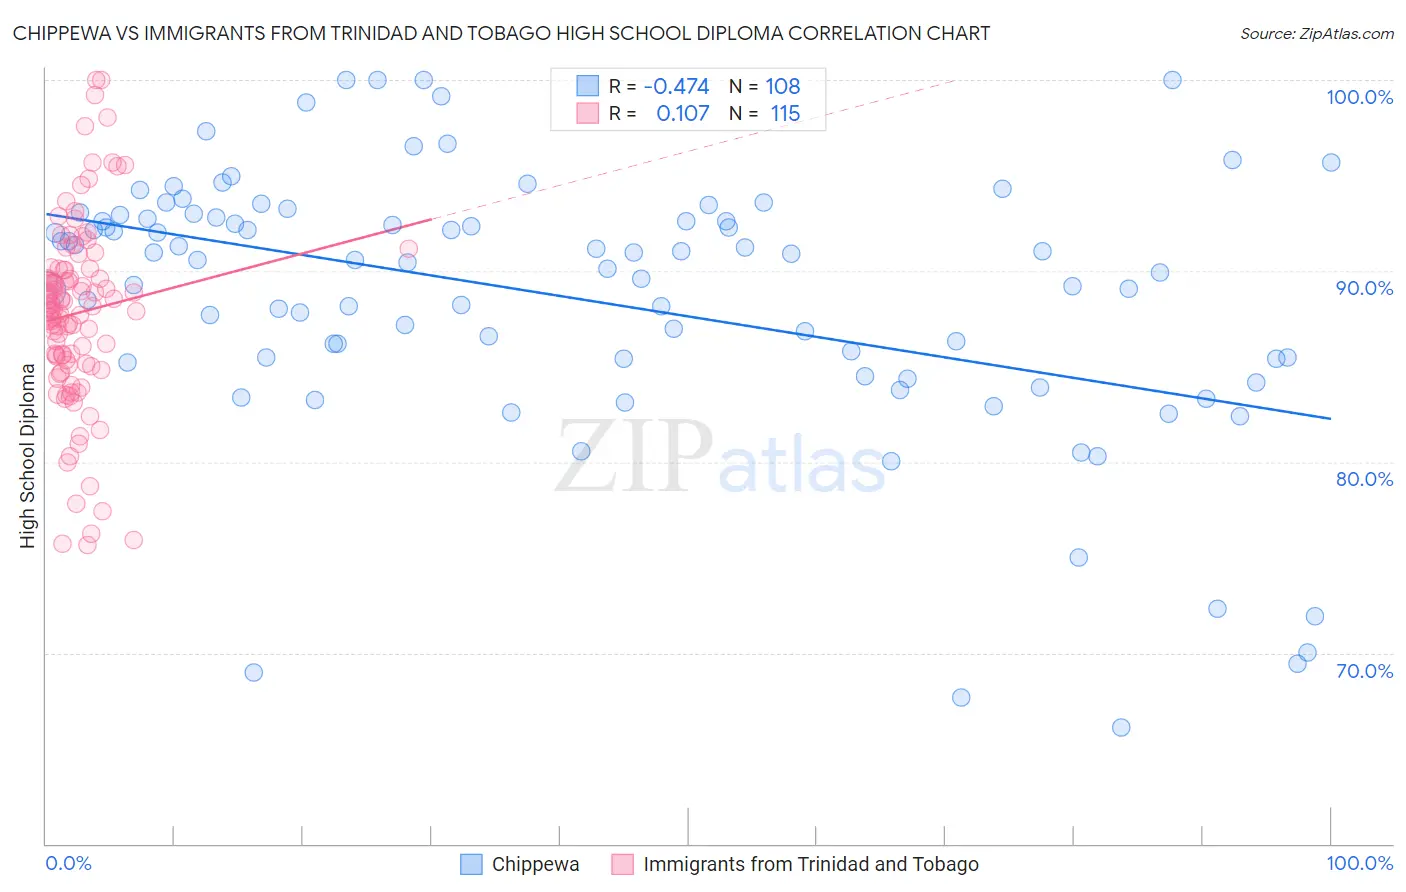
Chippewa vs Immigrants from Trinidad and Tobago High School Diploma Correlation Chart

The statistical analysis conducted on geographies consisting of 215,068,347 people shows a moderate negative correlation between the proportion of Chippewa and percentage of population with at least high school diploma education in the United States with a correlation coefficient (R) of -0.474 and weighted average of 89.7%. Similarly, the statistical analysis conducted on geographies consisting of 223,527,464 people shows a poor positive correlation between the proportion of Immigrants from Trinidad and Tobago and percentage of population with at least high school diploma education in the United States with a correlation coefficient (R) of 0.107 and weighted average of 86.8%, a difference of 3.4%.
Chippewa vs Immigrants from Trinidad and Tobago High School Diploma

High School Diploma Correlation Summary

MeasurementChippewaImmigrants from Trinidad and Tobago
Minimum66.1%75.6%
Maximum100.0%100.0%
Range33.9%24.4%
Mean88.6%87.8%
Median90.6%88.1%
Interquartile 25% (IQ1)85.4%85.1%
Interquartile 75% (IQ3)92.8%90.1%
Interquartile Range (IQR)7.4%4.9%
Standard Deviation (Sample)7.0%4.9%
Standard Deviation (Population)7.0%4.8%

Similar Demographics by High School Diploma

Demographics Similar to Chippewa by High School Diploma

In terms of high school diploma, the demographic groups most similar to Chippewa are Immigrants from Bosnia and Herzegovina (89.8%, a difference of 0.050%), Albanian (89.8%, a difference of 0.050%), Immigrants from Jordan (89.8%, a difference of 0.050%), Immigrants from Italy (89.8%, a difference of 0.060%), and Ugandan (89.7%, a difference of 0.060%).
DemographicsRating | RankHigh School Diploma
Puget Sound Salish
89.1
/100
|
#128
Excellent
89.9%
Basques
88.5
/100
|
#129
Excellent
89.8%
Immigrants | Ukraine
87.9
/100
|
#130
Excellent
89.8%
Immigrants | Italy
87.4
/100
|
#131
Excellent
89.8%
Immigrants | Bosnia and Herzegovina
87.3
/100
|
#132
Excellent
89.8%
Albanians
87.2
/100
|
#133
Excellent
89.8%
Immigrants | Jordan
87.2
/100
|
#134
Excellent
89.8%
Chippewa
85.6
/100
|
#135
Excellent
89.7%
Ugandans
83.7
/100
|
#136
Excellent
89.7%
Arabs
83.6
/100
|
#137
Excellent
89.7%
Assyrians/Chaldeans/Syriacs
82.5
/100
|
#138
Excellent
89.7%
Kenyans
81.4
/100
|
#139
Excellent
89.6%
Immigrants | Egypt
81.2
/100
|
#140
Excellent
89.6%
Chileans
79.0
/100
|
#141
Good
89.6%
Indians (Asian)
78.8
/100
|
#142
Good
89.6%

Demographics Similar to Immigrants from Trinidad and Tobago by High School Diploma

In terms of high school diploma, the demographic groups most similar to Immigrants from Trinidad and Tobago are Immigrants from Burma/Myanmar (86.7%, a difference of 0.070%), Barbadian (86.7%, a difference of 0.080%), Bangladeshi (86.9%, a difference of 0.14%), Immigrants from Jamaica (86.9%, a difference of 0.15%), and West Indian (86.9%, a difference of 0.19%).
DemographicsRating | RankHigh School Diploma
Pennsylvania Germans
0.2
/100
|
#268
Tragic
87.0%
Sri Lankans
0.2
/100
|
#269
Tragic
87.0%
Malaysians
0.2
/100
|
#270
Tragic
87.0%
West Indians
0.1
/100
|
#271
Tragic
86.9%
Trinidadians and Tobagonians
0.1
/100
|
#272
Tragic
86.9%
Immigrants | Jamaica
0.1
/100
|
#273
Tragic
86.9%
Bangladeshis
0.1
/100
|
#274
Tragic
86.9%
Immigrants | Trinidad and Tobago
0.1
/100
|
#275
Tragic
86.8%
Immigrants | Burma/Myanmar
0.1
/100
|
#276
Tragic
86.7%
Barbadians
0.1
/100
|
#277
Tragic
86.7%
Hopi
0.1
/100
|
#278
Tragic
86.6%
Immigrants | Laos
0.0
/100
|
#279
Tragic
86.6%
Pueblo
0.0
/100
|
#280
Tragic
86.5%
Indonesians
0.0
/100
|
#281
Tragic
86.5%
Dutch West Indians
0.0
/100
|
#282
Tragic
86.5%