Chippewa vs Immigrants from Colombia Associate's Degree
COMPARE
Chippewa
Immigrants from Colombia
Associate's Degree
Associate's Degree Comparison
Chippewa
Immigrants from Colombia
40.7%
ASSOCIATE'S DEGREE
0.2/ 100
METRIC RATING
270th/ 347
METRIC RANK
46.0%
ASSOCIATE'S DEGREE
41.3/ 100
METRIC RATING
181st/ 347
METRIC RANK
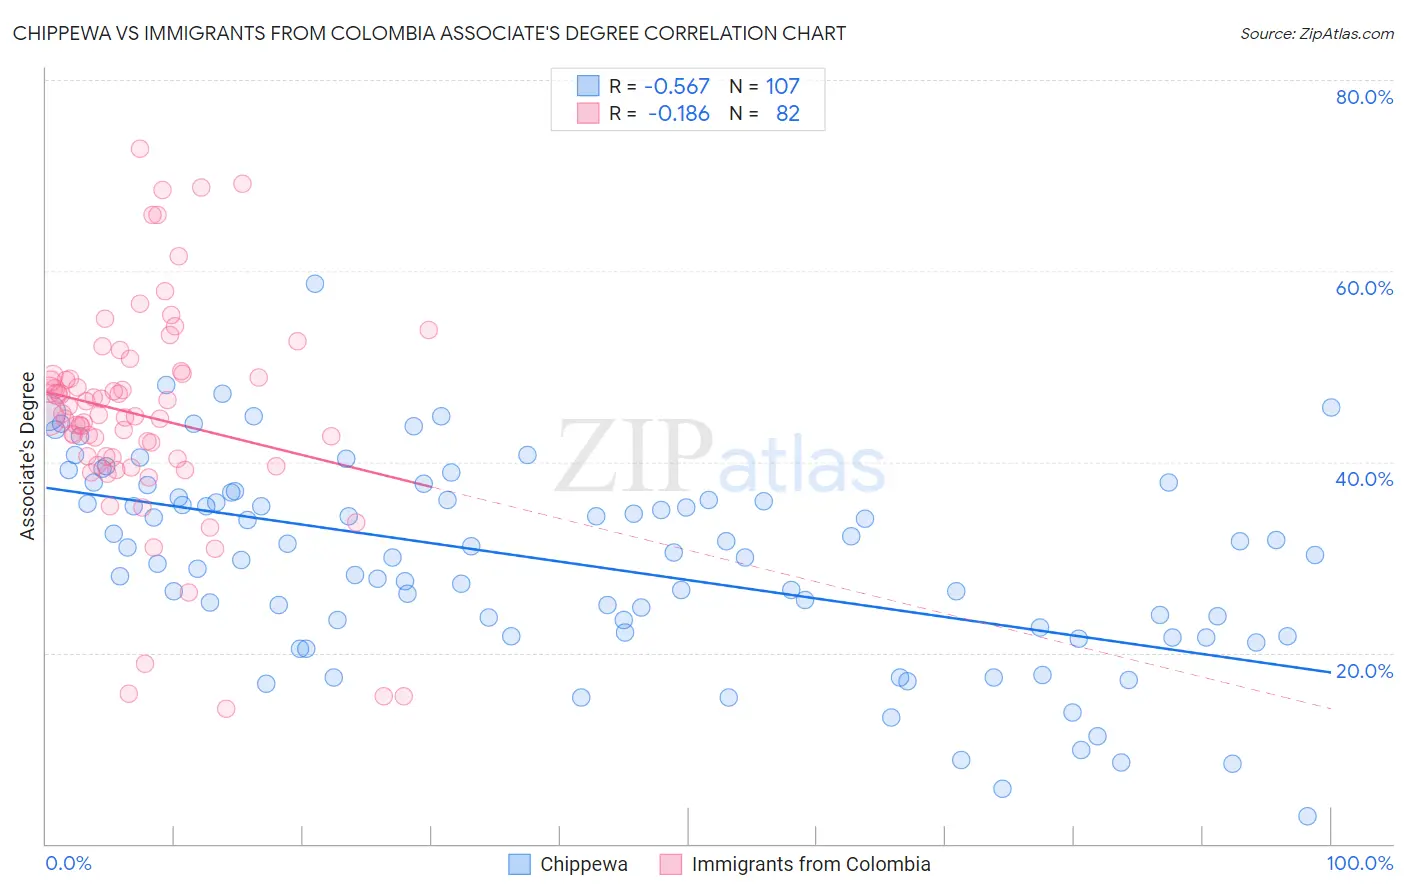
Chippewa vs Immigrants from Colombia Associate's Degree Correlation Chart
The statistical analysis conducted on geographies consisting of 215,061,498 people shows a substantial negative correlation between the proportion of Chippewa and percentage of population with at least associate's degree education in the United States with a correlation coefficient (R) of -0.567 and weighted average of 40.7%. Similarly, the statistical analysis conducted on geographies consisting of 378,676,952 people shows a poor negative correlation between the proportion of Immigrants from Colombia and percentage of population with at least associate's degree education in the United States with a correlation coefficient (R) of -0.186 and weighted average of 46.0%, a difference of 13.0%.
Associate's Degree Correlation Summary
| Measurement | Chippewa | Immigrants from Colombia |
| Minimum | 2.9% | 14.1% |
| Maximum | 58.7% | 72.8% |
| Range | 55.8% | 58.7% |
| Mean | 29.5% | 44.8% |
| Median | 30.2% | 44.8% |
| Interquartile 25% (IQ1) | 22.1% | 40.3% |
| Interquartile 75% (IQ3) | 36.2% | 49.1% |
| Interquartile Range (IQR) | 14.1% | 8.8% |
| Standard Deviation (Sample) | 10.5% | 11.4% |
| Standard Deviation (Population) | 10.4% | 11.3% |
Similar Demographics by Associate's Degree
Demographics Similar to Chippewa by Associate's Degree
In terms of associate's degree, the demographic groups most similar to Chippewa are American (40.8%, a difference of 0.050%), Immigrants from Laos (40.7%, a difference of 0.18%), Central American Indian (40.8%, a difference of 0.23%), Belizean (40.6%, a difference of 0.25%), and Hawaiian (40.9%, a difference of 0.42%).
| Demographics | Rating | Rank | Associate's Degree |
| Immigrants | Jamaica | 0.3 /100 | #263 | Tragic 41.5% |
| Osage | 0.3 /100 | #264 | Tragic 41.5% |
| Africans | 0.2 /100 | #265 | Tragic 41.1% |
| Samoans | 0.2 /100 | #266 | Tragic 41.1% |
| Hawaiians | 0.2 /100 | #267 | Tragic 40.9% |
| Central American Indians | 0.2 /100 | #268 | Tragic 40.8% |
| Americans | 0.2 /100 | #269 | Tragic 40.8% |
| Chippewa | 0.2 /100 | #270 | Tragic 40.7% |
| Immigrants | Laos | 0.1 /100 | #271 | Tragic 40.7% |
| Belizeans | 0.1 /100 | #272 | Tragic 40.6% |
| Puget Sound Salish | 0.1 /100 | #273 | Tragic 40.5% |
| Immigrants | Dominica | 0.1 /100 | #274 | Tragic 40.5% |
| Potawatomi | 0.1 /100 | #275 | Tragic 40.4% |
| Puerto Ricans | 0.1 /100 | #276 | Tragic 40.4% |
| Blackfeet | 0.1 /100 | #277 | Tragic 40.3% |
Demographics Similar to Immigrants from Colombia by Associate's Degree
In terms of associate's degree, the demographic groups most similar to Immigrants from Colombia are Swiss (46.0%, a difference of 0.070%), Yugoslavian (46.0%, a difference of 0.080%), Czechoslovakian (46.0%, a difference of 0.10%), Costa Rican (46.0%, a difference of 0.21%), and Welsh (45.9%, a difference of 0.27%).
| Demographics | Rating | Rank | Associate's Degree |
| English | 50.0 /100 | #174 | Average 46.4% |
| Belgians | 48.9 /100 | #175 | Average 46.3% |
| Finns | 48.5 /100 | #176 | Average 46.3% |
| Slovaks | 48.4 /100 | #177 | Average 46.3% |
| Immigrants | Bosnia and Herzegovina | 48.3 /100 | #178 | Average 46.3% |
| Sri Lankans | 47.6 /100 | #179 | Average 46.3% |
| Bermudans | 46.4 /100 | #180 | Average 46.2% |
| Immigrants | Colombia | 41.3 /100 | #181 | Average 46.0% |
| Swiss | 40.4 /100 | #182 | Average 46.0% |
| Yugoslavians | 40.2 /100 | #183 | Average 46.0% |
| Czechoslovakians | 40.0 /100 | #184 | Average 46.0% |
| Costa Ricans | 38.6 /100 | #185 | Fair 46.0% |
| Welsh | 37.9 /100 | #186 | Fair 45.9% |
| Immigrants | Uruguay | 35.5 /100 | #187 | Fair 45.8% |
| Ghanaians | 35.5 /100 | #188 | Fair 45.8% |