Chippewa vs Immigrants from China Bachelor's Degree
COMPARE
Chippewa
Immigrants from China
Bachelor's Degree
Bachelor's Degree Comparison
Chippewa
Immigrants from China
30.6%
BACHELOR'S DEGREE
0.0/ 100
METRIC RATING
298th/ 347
METRIC RANK
48.4%
BACHELOR'S DEGREE
100.0/ 100
METRIC RATING
12th/ 347
METRIC RANK
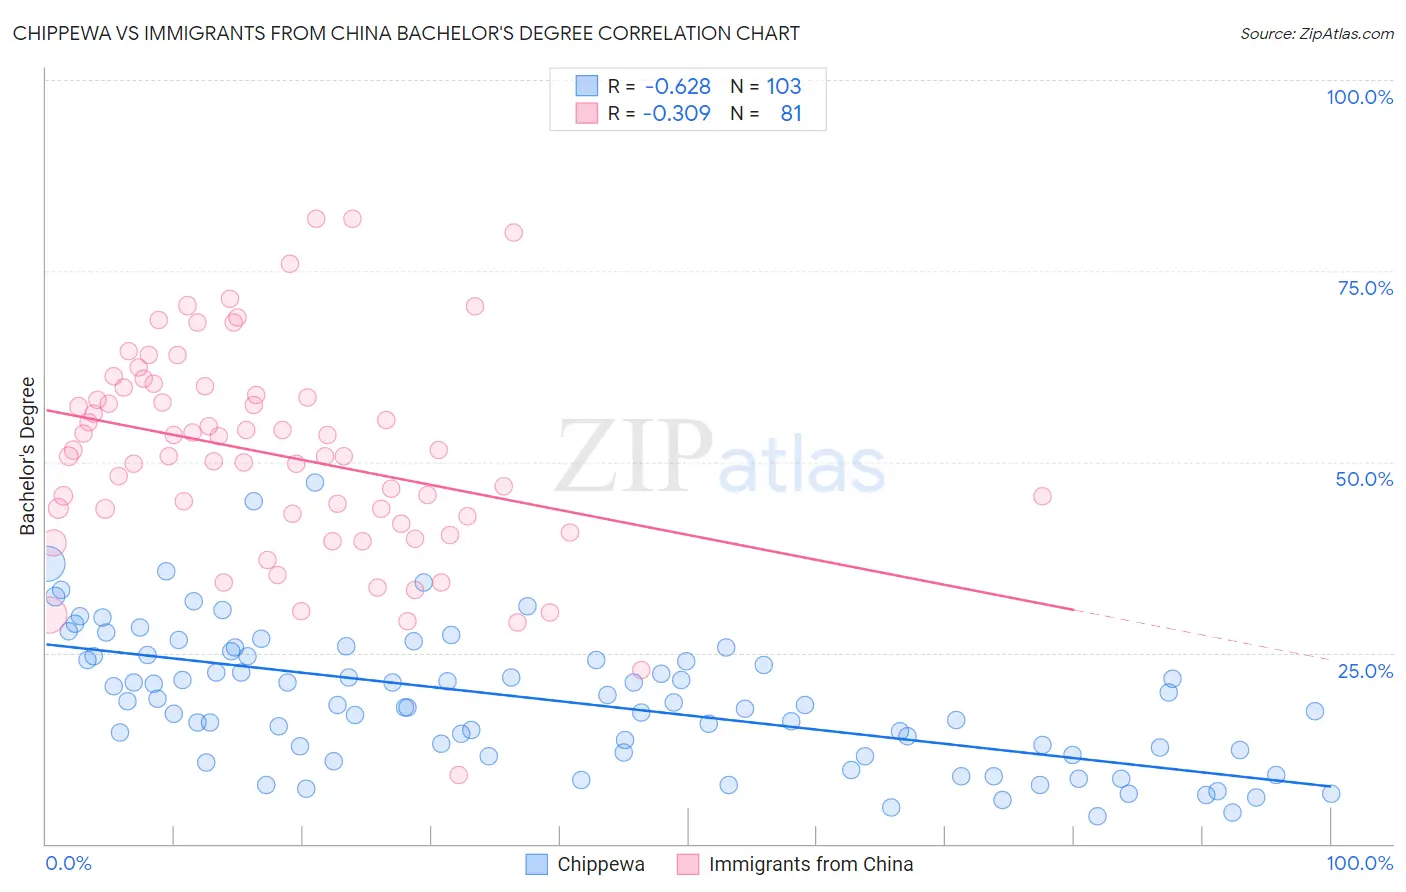
Chippewa vs Immigrants from China Bachelor's Degree Correlation Chart
The statistical analysis conducted on geographies consisting of 215,055,774 people shows a significant negative correlation between the proportion of Chippewa and percentage of population with at least bachelor's degree education in the United States with a correlation coefficient (R) of -0.628 and weighted average of 30.6%. Similarly, the statistical analysis conducted on geographies consisting of 457,002,044 people shows a mild negative correlation between the proportion of Immigrants from China and percentage of population with at least bachelor's degree education in the United States with a correlation coefficient (R) of -0.309 and weighted average of 48.4%, a difference of 58.4%.
Bachelor's Degree Correlation Summary
| Measurement | Chippewa | Immigrants from China |
| Minimum | 3.6% | 9.0% |
| Maximum | 47.3% | 81.9% |
| Range | 43.7% | 72.9% |
| Mean | 18.8% | 51.0% |
| Median | 18.2% | 50.8% |
| Interquartile 25% (IQ1) | 12.0% | 42.4% |
| Interquartile 75% (IQ3) | 24.6% | 59.2% |
| Interquartile Range (IQR) | 12.6% | 16.8% |
| Standard Deviation (Sample) | 8.9% | 13.7% |
| Standard Deviation (Population) | 8.8% | 13.7% |
Similar Demographics by Bachelor's Degree
Demographics Similar to Chippewa by Bachelor's Degree
In terms of bachelor's degree, the demographic groups most similar to Chippewa are Immigrants from Haiti (30.6%, a difference of 0.25%), Puget Sound Salish (30.7%, a difference of 0.31%), Immigrants from Dominican Republic (30.7%, a difference of 0.41%), Chickasaw (30.4%, a difference of 0.52%), and Immigrants from Micronesia (30.4%, a difference of 0.54%).
| Demographics | Rating | Rank | Bachelor's Degree |
| Blacks/African Americans | 0.1 /100 | #291 | Tragic 30.9% |
| Ute | 0.1 /100 | #292 | Tragic 30.9% |
| Cape Verdeans | 0.1 /100 | #293 | Tragic 30.9% |
| Immigrants | Guatemala | 0.0 /100 | #294 | Tragic 30.8% |
| Immigrants | Dominican Republic | 0.0 /100 | #295 | Tragic 30.7% |
| Puget Sound Salish | 0.0 /100 | #296 | Tragic 30.7% |
| Immigrants | Haiti | 0.0 /100 | #297 | Tragic 30.6% |
| Chippewa | 0.0 /100 | #298 | Tragic 30.6% |
| Chickasaw | 0.0 /100 | #299 | Tragic 30.4% |
| Immigrants | Micronesia | 0.0 /100 | #300 | Tragic 30.4% |
| Immigrants | Cuba | 0.0 /100 | #301 | Tragic 30.3% |
| Mexican American Indians | 0.0 /100 | #302 | Tragic 30.2% |
| Bangladeshis | 0.0 /100 | #303 | Tragic 30.2% |
| Cherokee | 0.0 /100 | #304 | Tragic 30.2% |
| Immigrants | Latin America | 0.0 /100 | #305 | Tragic 30.1% |
Demographics Similar to Immigrants from China by Bachelor's Degree
In terms of bachelor's degree, the demographic groups most similar to Immigrants from China are Immigrants from South Central Asia (48.3%, a difference of 0.14%), Immigrants from Australia (48.5%, a difference of 0.18%), Immigrants from Hong Kong (48.2%, a difference of 0.42%), Immigrants from Eastern Asia (48.1%, a difference of 0.56%), and Soviet Union (47.9%, a difference of 1.0%).
| Demographics | Rating | Rank | Bachelor's Degree |
| Iranians | 100.0 /100 | #5 | Exceptional 51.0% |
| Okinawans | 100.0 /100 | #6 | Exceptional 50.5% |
| Immigrants | Iran | 100.0 /100 | #7 | Exceptional 50.3% |
| Thais | 100.0 /100 | #8 | Exceptional 50.1% |
| Immigrants | Israel | 100.0 /100 | #9 | Exceptional 50.0% |
| Cypriots | 100.0 /100 | #10 | Exceptional 49.0% |
| Immigrants | Australia | 100.0 /100 | #11 | Exceptional 48.5% |
| Immigrants | China | 100.0 /100 | #12 | Exceptional 48.4% |
| Immigrants | South Central Asia | 100.0 /100 | #13 | Exceptional 48.3% |
| Immigrants | Hong Kong | 100.0 /100 | #14 | Exceptional 48.2% |
| Immigrants | Eastern Asia | 100.0 /100 | #15 | Exceptional 48.1% |
| Soviet Union | 100.0 /100 | #16 | Exceptional 47.9% |
| Eastern Europeans | 100.0 /100 | #17 | Exceptional 47.5% |
| Indians (Asian) | 100.0 /100 | #18 | Exceptional 47.4% |
| Cambodians | 100.0 /100 | #19 | Exceptional 47.2% |