Chippewa vs Hispanic or Latino Doctorate Degree
COMPARE
Chippewa
Hispanic or Latino
Doctorate Degree
Doctorate Degree Comparison
Chippewa
Hispanics or Latinos
1.5%
DOCTORATE DEGREE
0.9/ 100
METRIC RATING
257th/ 347
METRIC RANK
1.3%
DOCTORATE DEGREE
0.0/ 100
METRIC RATING
327th/ 347
METRIC RANK
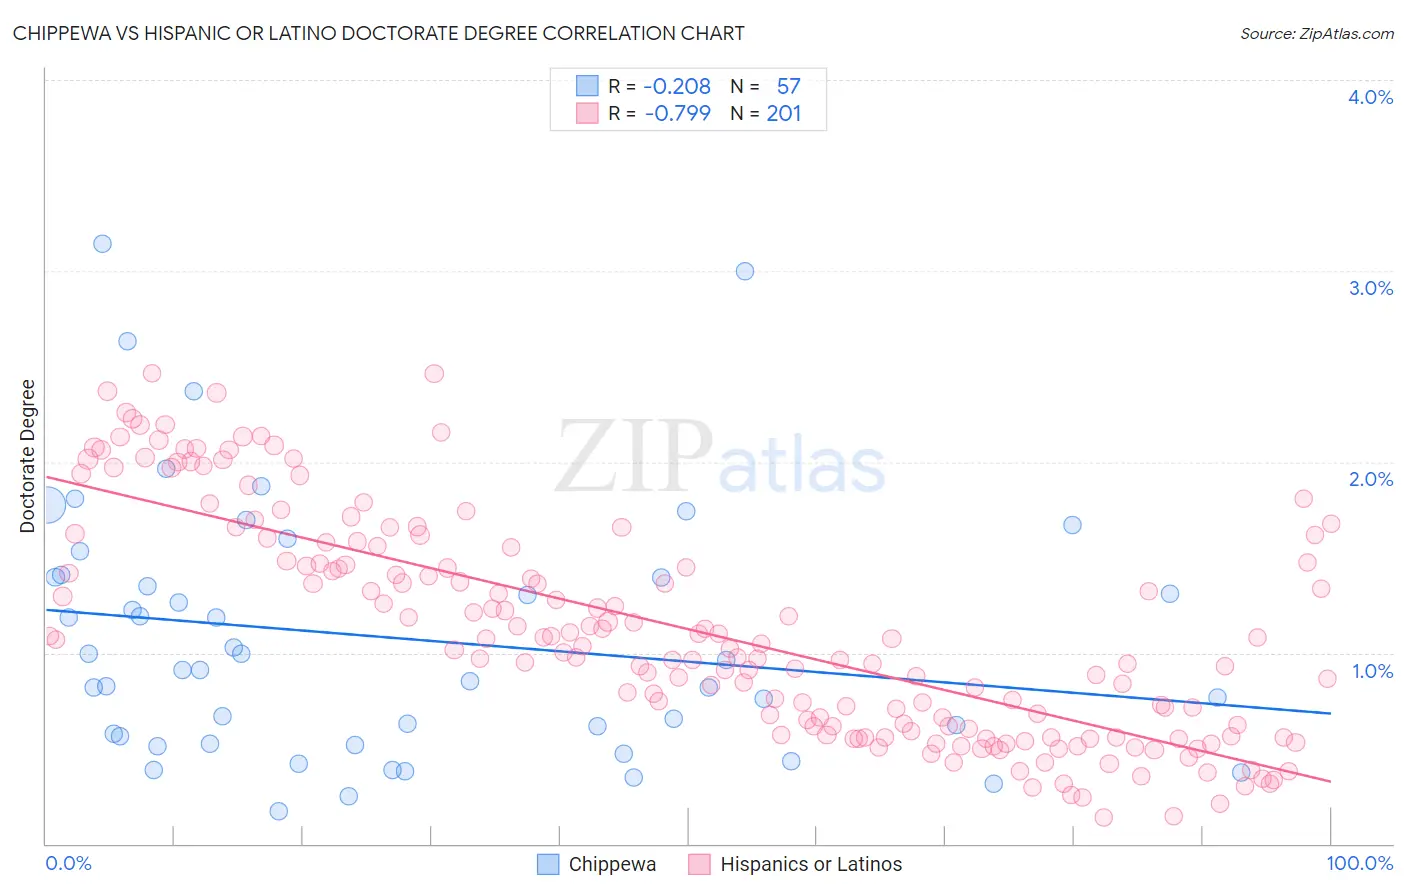
Chippewa vs Hispanic or Latino Doctorate Degree Correlation Chart
The statistical analysis conducted on geographies consisting of 212,158,664 people shows a weak negative correlation between the proportion of Chippewa and percentage of population with at least doctorate degree education in the United States with a correlation coefficient (R) of -0.208 and weighted average of 1.5%. Similarly, the statistical analysis conducted on geographies consisting of 551,277,814 people shows a strong negative correlation between the proportion of Hispanics or Latinos and percentage of population with at least doctorate degree education in the United States with a correlation coefficient (R) of -0.799 and weighted average of 1.3%, a difference of 16.0%.
Doctorate Degree Correlation Summary
| Measurement | Chippewa | Hispanic or Latino |
| Minimum | 0.17% | 0.14% |
| Maximum | 3.1% | 2.5% |
| Range | 3.0% | 2.3% |
| Mean | 1.1% | 1.1% |
| Median | 0.91% | 1.0% |
| Interquartile 25% (IQ1) | 0.54% | 0.60% |
| Interquartile 75% (IQ3) | 1.4% | 1.6% |
| Interquartile Range (IQR) | 0.86% | 0.96% |
| Standard Deviation (Sample) | 0.67% | 0.58% |
| Standard Deviation (Population) | 0.67% | 0.58% |
Similar Demographics by Doctorate Degree
Demographics Similar to Chippewa by Doctorate Degree
In terms of doctorate degree, the demographic groups most similar to Chippewa are Central American Indian (1.5%, a difference of 0.22%), Immigrants from West Indies (1.5%, a difference of 0.26%), Immigrants from Cambodia (1.5%, a difference of 0.27%), Trinidadian and Tobagonian (1.5%, a difference of 0.27%), and Liberian (1.5%, a difference of 0.28%).
| Demographics | Rating | Rank | Doctorate Degree |
| Immigrants | Fiji | 1.6 /100 | #250 | Tragic 1.6% |
| Apache | 1.3 /100 | #251 | Tragic 1.5% |
| Yuman | 1.1 /100 | #252 | Tragic 1.5% |
| Americans | 1.0 /100 | #253 | Tragic 1.5% |
| Immigrants | Cambodia | 1.0 /100 | #254 | Tragic 1.5% |
| Trinidadians and Tobagonians | 1.0 /100 | #255 | Tragic 1.5% |
| Central American Indians | 1.0 /100 | #256 | Tragic 1.5% |
| Chippewa | 0.9 /100 | #257 | Tragic 1.5% |
| Immigrants | West Indies | 0.9 /100 | #258 | Tragic 1.5% |
| Liberians | 0.9 /100 | #259 | Tragic 1.5% |
| Japanese | 0.9 /100 | #260 | Tragic 1.5% |
| Immigrants | Portugal | 0.8 /100 | #261 | Tragic 1.5% |
| Chickasaw | 0.7 /100 | #262 | Tragic 1.5% |
| Immigrants | Bahamas | 0.7 /100 | #263 | Tragic 1.5% |
| Blackfeet | 0.7 /100 | #264 | Tragic 1.5% |
Demographics Similar to Hispanics or Latinos by Doctorate Degree
In terms of doctorate degree, the demographic groups most similar to Hispanics or Latinos are Immigrants from Cabo Verde (1.3%, a difference of 0.29%), Pima (1.3%, a difference of 0.31%), Inupiat (1.3%, a difference of 0.58%), Haitian (1.3%, a difference of 0.63%), and Native/Alaskan (1.3%, a difference of 0.70%).
| Demographics | Rating | Rank | Doctorate Degree |
| Immigrants | St. Vincent and the Grenadines | 0.1 /100 | #320 | Tragic 1.3% |
| Dutch West Indians | 0.1 /100 | #321 | Tragic 1.3% |
| Seminole | 0.1 /100 | #322 | Tragic 1.3% |
| Immigrants | Belize | 0.1 /100 | #323 | Tragic 1.3% |
| Natives/Alaskans | 0.0 /100 | #324 | Tragic 1.3% |
| Pima | 0.0 /100 | #325 | Tragic 1.3% |
| Immigrants | Cabo Verde | 0.0 /100 | #326 | Tragic 1.3% |
| Hispanics or Latinos | 0.0 /100 | #327 | Tragic 1.3% |
| Inupiat | 0.0 /100 | #328 | Tragic 1.3% |
| Haitians | 0.0 /100 | #329 | Tragic 1.3% |
| Yup'ik | 0.0 /100 | #330 | Tragic 1.3% |
| Immigrants | Latin America | 0.0 /100 | #331 | Tragic 1.3% |
| Yakama | 0.0 /100 | #332 | Tragic 1.3% |
| Immigrants | Caribbean | 0.0 /100 | #333 | Tragic 1.3% |
| Immigrants | Dominican Republic | 0.0 /100 | #334 | Tragic 1.3% |