Chinese vs Slovene Master's Degree
COMPARE
Chinese
Slovene
Master's Degree
Master's Degree Comparison
Chinese
Slovenes
14.6%
MASTER'S DEGREE
32.5/ 100
METRIC RATING
194th/ 347
METRIC RANK
15.5%
MASTER'S DEGREE
78.0/ 100
METRIC RATING
150th/ 347
METRIC RANK
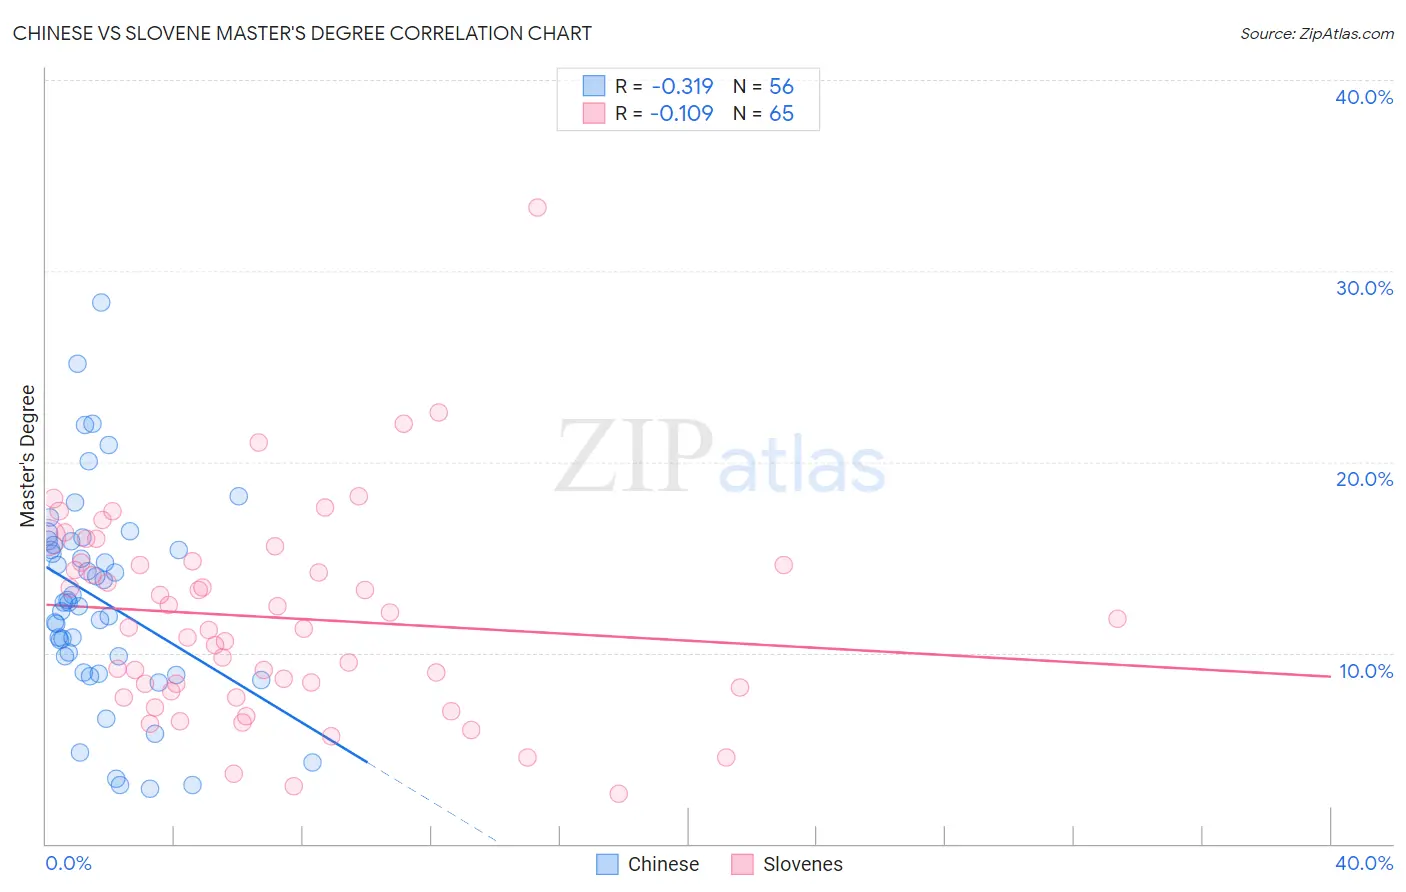
Chinese vs Slovene Master's Degree Correlation Chart
The statistical analysis conducted on geographies consisting of 64,806,468 people shows a mild negative correlation between the proportion of Chinese and percentage of population with at least master's degree education in the United States with a correlation coefficient (R) of -0.319 and weighted average of 14.6%. Similarly, the statistical analysis conducted on geographies consisting of 261,310,088 people shows a poor negative correlation between the proportion of Slovenes and percentage of population with at least master's degree education in the United States with a correlation coefficient (R) of -0.109 and weighted average of 15.5%, a difference of 6.5%.
Master's Degree Correlation Summary
| Measurement | Chinese | Slovene |
| Minimum | 2.9% | 2.6% |
| Maximum | 28.4% | 33.3% |
| Range | 25.5% | 30.7% |
| Mean | 12.8% | 11.9% |
| Median | 12.6% | 11.3% |
| Interquartile 25% (IQ1) | 9.4% | 8.1% |
| Interquartile 75% (IQ3) | 15.7% | 14.8% |
| Interquartile Range (IQR) | 6.3% | 6.7% |
| Standard Deviation (Sample) | 5.4% | 5.4% |
| Standard Deviation (Population) | 5.3% | 5.3% |
Similar Demographics by Master's Degree
Demographics Similar to Chinese by Master's Degree
In terms of master's degree, the demographic groups most similar to Chinese are Immigrants from Nigeria (14.6%, a difference of 0.040%), Immigrants from Middle Africa (14.6%, a difference of 0.17%), Danish (14.5%, a difference of 0.18%), Welsh (14.6%, a difference of 0.26%), and Czechoslovakian (14.5%, a difference of 0.39%).
| Demographics | Rating | Rank | Master's Degree |
| Basques | 36.5 /100 | #187 | Fair 14.7% |
| Immigrants | Costa Rica | 36.2 /100 | #188 | Fair 14.7% |
| Immigrants | Immigrants | 36.0 /100 | #189 | Fair 14.6% |
| Spaniards | 35.8 /100 | #190 | Fair 14.6% |
| Welsh | 34.2 /100 | #191 | Fair 14.6% |
| Immigrants | Middle Africa | 33.6 /100 | #192 | Fair 14.6% |
| Immigrants | Nigeria | 32.7 /100 | #193 | Fair 14.6% |
| Chinese | 32.5 /100 | #194 | Fair 14.6% |
| Danes | 31.3 /100 | #195 | Fair 14.5% |
| Czechoslovakians | 29.9 /100 | #196 | Fair 14.5% |
| Belgians | 28.0 /100 | #197 | Fair 14.5% |
| West Indians | 27.4 /100 | #198 | Fair 14.5% |
| Immigrants | Armenia | 27.2 /100 | #199 | Fair 14.5% |
| Panamanians | 25.1 /100 | #200 | Fair 14.4% |
| Scotch-Irish | 25.0 /100 | #201 | Fair 14.4% |
Demographics Similar to Slovenes by Master's Degree
In terms of master's degree, the demographic groups most similar to Slovenes are Ghanaian (15.5%, a difference of 0.030%), Immigrants from Senegal (15.5%, a difference of 0.040%), Iraqi (15.5%, a difference of 0.12%), Slavic (15.5%, a difference of 0.17%), and Icelander (15.5%, a difference of 0.20%).
| Demographics | Rating | Rank | Master's Degree |
| Immigrants | Venezuela | 83.6 /100 | #143 | Excellent 15.7% |
| Canadians | 83.3 /100 | #144 | Excellent 15.7% |
| South Americans | 81.3 /100 | #145 | Excellent 15.6% |
| Immigrants | Afghanistan | 79.4 /100 | #146 | Good 15.6% |
| Hungarians | 79.1 /100 | #147 | Good 15.6% |
| Immigrants | Senegal | 78.2 /100 | #148 | Good 15.5% |
| Ghanaians | 78.2 /100 | #149 | Good 15.5% |
| Slovenes | 78.0 /100 | #150 | Good 15.5% |
| Iraqis | 77.3 /100 | #151 | Good 15.5% |
| Slavs | 77.0 /100 | #152 | Good 15.5% |
| Icelanders | 76.8 /100 | #153 | Good 15.5% |
| Immigrants | South America | 76.3 /100 | #154 | Good 15.5% |
| Immigrants | Bangladesh | 76.1 /100 | #155 | Good 15.5% |
| Bermudans | 73.9 /100 | #156 | Good 15.4% |
| Immigrants | Cameroon | 71.7 /100 | #157 | Good 15.4% |