Chinese vs Portuguese Associate's Degree
COMPARE
Chinese
Portuguese
Associate's Degree
Associate's Degree Comparison
Chinese
Portuguese
48.5%
ASSOCIATE'S DEGREE
92.5/ 100
METRIC RATING
125th/ 347
METRIC RANK
44.1%
ASSOCIATE'S DEGREE
7.2/ 100
METRIC RATING
220th/ 347
METRIC RANK
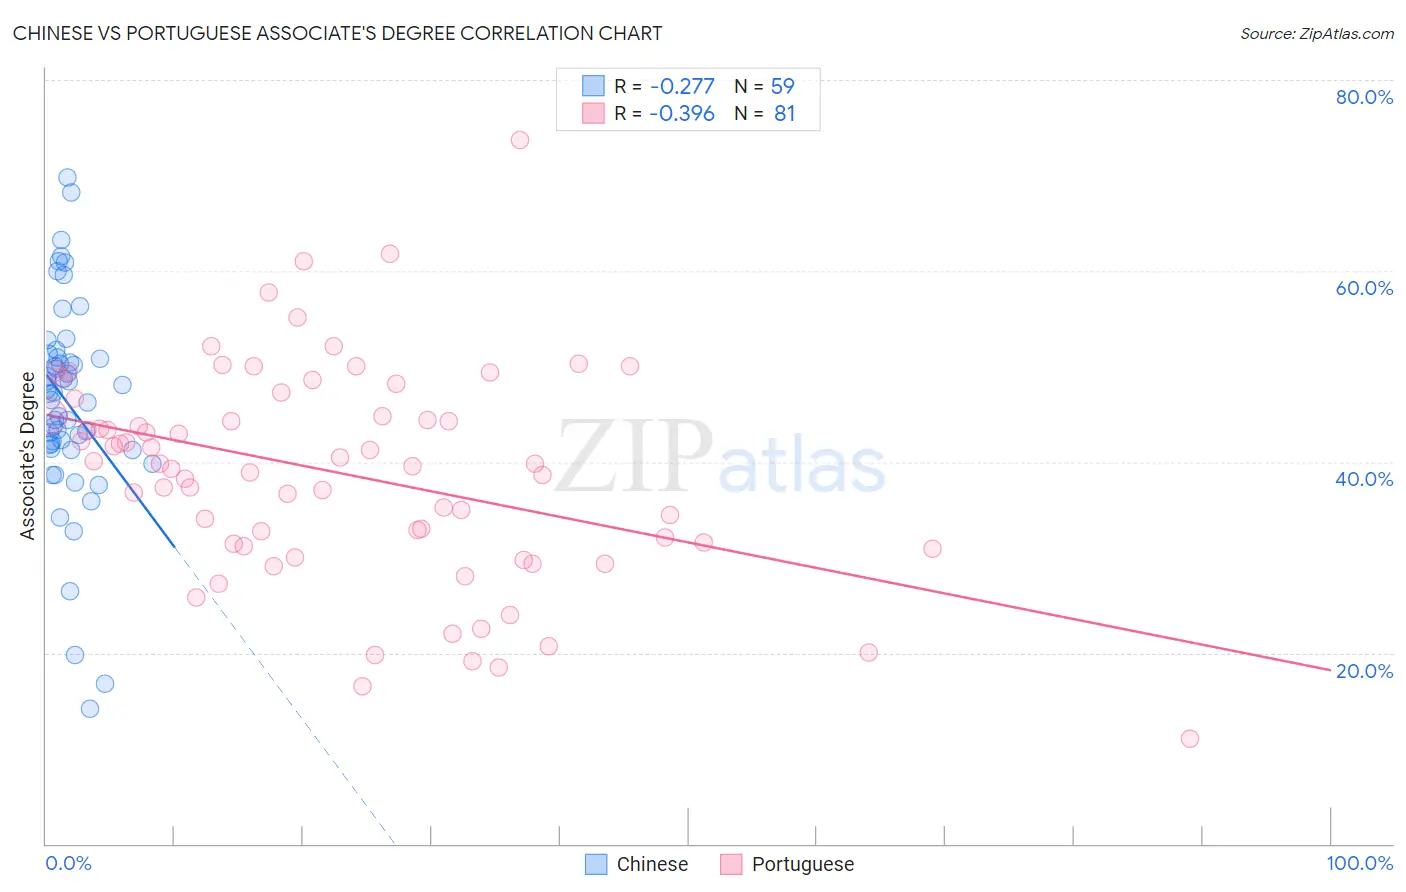
Chinese vs Portuguese Associate's Degree Correlation Chart
The statistical analysis conducted on geographies consisting of 64,809,883 people shows a weak negative correlation between the proportion of Chinese and percentage of population with at least associate's degree education in the United States with a correlation coefficient (R) of -0.277 and weighted average of 48.5%. Similarly, the statistical analysis conducted on geographies consisting of 450,325,825 people shows a mild negative correlation between the proportion of Portuguese and percentage of population with at least associate's degree education in the United States with a correlation coefficient (R) of -0.396 and weighted average of 44.1%, a difference of 10.0%.
Associate's Degree Correlation Summary
| Measurement | Chinese | Portuguese |
| Minimum | 14.2% | 11.0% |
| Maximum | 69.8% | 73.7% |
| Range | 55.6% | 62.7% |
| Mean | 46.1% | 38.8% |
| Median | 47.1% | 39.8% |
| Interquartile 25% (IQ1) | 41.4% | 31.3% |
| Interquartile 75% (IQ3) | 50.9% | 45.7% |
| Interquartile Range (IQR) | 9.5% | 14.4% |
| Standard Deviation (Sample) | 10.8% | 11.3% |
| Standard Deviation (Population) | 10.7% | 11.2% |
Similar Demographics by Associate's Degree
Demographics Similar to Chinese by Associate's Degree
In terms of associate's degree, the demographic groups most similar to Chinese are Serbian (48.5%, a difference of 0.020%), Immigrants from Syria (48.5%, a difference of 0.090%), Immigrants from Uganda (48.5%, a difference of 0.10%), Immigrants from Eastern Africa (48.4%, a difference of 0.22%), and Swedish (48.4%, a difference of 0.25%).
| Demographics | Rating | Rank | Associate's Degree |
| Albanians | 94.7 /100 | #118 | Exceptional 48.8% |
| Lebanese | 94.6 /100 | #119 | Exceptional 48.8% |
| Alsatians | 94.6 /100 | #120 | Exceptional 48.8% |
| Ugandans | 93.9 /100 | #121 | Exceptional 48.7% |
| Italians | 93.9 /100 | #122 | Exceptional 48.7% |
| Brazilians | 93.7 /100 | #123 | Exceptional 48.7% |
| Serbians | 92.6 /100 | #124 | Exceptional 48.5% |
| Chinese | 92.5 /100 | #125 | Exceptional 48.5% |
| Immigrants | Syria | 92.2 /100 | #126 | Exceptional 48.5% |
| Immigrants | Uganda | 92.1 /100 | #127 | Exceptional 48.5% |
| Immigrants | Eastern Africa | 91.6 /100 | #128 | Exceptional 48.4% |
| Swedes | 91.5 /100 | #129 | Exceptional 48.4% |
| Immigrants | Jordan | 91.2 /100 | #130 | Exceptional 48.4% |
| Icelanders | 90.8 /100 | #131 | Exceptional 48.3% |
| Immigrants | Albania | 89.9 /100 | #132 | Excellent 48.2% |
Demographics Similar to Portuguese by Associate's Degree
In terms of associate's degree, the demographic groups most similar to Portuguese are White/Caucasian (44.2%, a difference of 0.070%), Immigrants from Western Africa (44.1%, a difference of 0.20%), Barbadian (43.9%, a difference of 0.47%), Spanish (44.4%, a difference of 0.55%), and Subsaharan African (43.9%, a difference of 0.57%).
| Demographics | Rating | Rank | Associate's Degree |
| Immigrants | Ghana | 14.2 /100 | #213 | Poor 44.8% |
| Immigrants | Middle Africa | 12.7 /100 | #214 | Poor 44.7% |
| Immigrants | Panama | 12.4 /100 | #215 | Poor 44.7% |
| Immigrants | Nigeria | 11.4 /100 | #216 | Poor 44.6% |
| Immigrants | Immigrants | 10.5 /100 | #217 | Poor 44.5% |
| Spanish | 9.4 /100 | #218 | Tragic 44.4% |
| Whites/Caucasians | 7.5 /100 | #219 | Tragic 44.2% |
| Portuguese | 7.2 /100 | #220 | Tragic 44.1% |
| Immigrants | Western Africa | 6.6 /100 | #221 | Tragic 44.1% |
| Barbadians | 5.8 /100 | #222 | Tragic 43.9% |
| Sub-Saharan Africans | 5.5 /100 | #223 | Tragic 43.9% |
| West Indians | 5.2 /100 | #224 | Tragic 43.8% |
| Guamanians/Chamorros | 4.8 /100 | #225 | Tragic 43.8% |
| Immigrants | Burma/Myanmar | 4.3 /100 | #226 | Tragic 43.7% |
| Trinidadians and Tobagonians | 4.0 /100 | #227 | Tragic 43.6% |