Chinese vs Immigrants from Uzbekistan 6th Grade
COMPARE
Chinese
Immigrants from Uzbekistan
6th Grade
6th Grade Comparison
Chinese
Immigrants from Uzbekistan
97.9%
6TH GRADE
100.0/ 100
METRIC RATING
35th/ 347
METRIC RANK
96.3%
6TH GRADE
0.2/ 100
METRIC RATING
268th/ 347
METRIC RANK
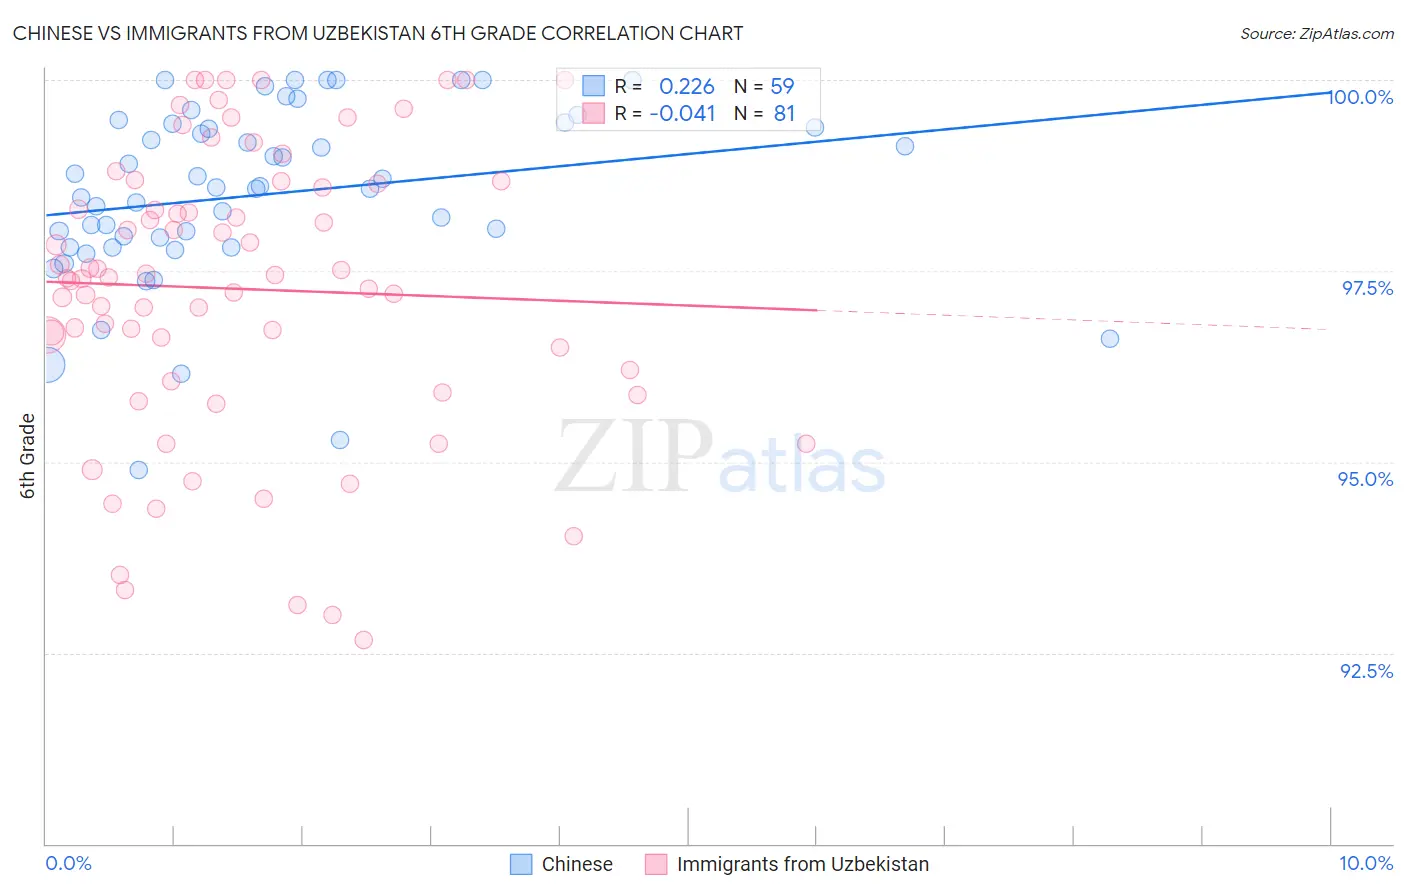
Chinese vs Immigrants from Uzbekistan 6th Grade Correlation Chart
The statistical analysis conducted on geographies consisting of 64,809,883 people shows a weak positive correlation between the proportion of Chinese and percentage of population with at least 6th grade education in the United States with a correlation coefficient (R) of 0.226 and weighted average of 97.9%. Similarly, the statistical analysis conducted on geographies consisting of 118,593,934 people shows no correlation between the proportion of Immigrants from Uzbekistan and percentage of population with at least 6th grade education in the United States with a correlation coefficient (R) of -0.041 and weighted average of 96.3%, a difference of 1.6%.
6th Grade Correlation Summary
| Measurement | Chinese | Immigrants from Uzbekistan |
| Minimum | 94.9% | 92.7% |
| Maximum | 100.0% | 100.0% |
| Range | 5.1% | 7.3% |
| Mean | 98.5% | 97.3% |
| Median | 98.6% | 97.4% |
| Interquartile 25% (IQ1) | 97.8% | 96.1% |
| Interquartile 75% (IQ3) | 99.4% | 98.7% |
| Interquartile Range (IQR) | 1.6% | 2.5% |
| Standard Deviation (Sample) | 1.2% | 1.9% |
| Standard Deviation (Population) | 1.2% | 1.9% |
Similar Demographics by 6th Grade
Demographics Similar to Chinese by 6th Grade
In terms of 6th grade, the demographic groups most similar to Chinese are Italian (97.9%, a difference of 0.0%), British (97.9%, a difference of 0.010%), Swiss (97.9%, a difference of 0.020%), Chippewa (97.9%, a difference of 0.030%), and Belgian (97.9%, a difference of 0.030%).
| Demographics | Rating | Rank | 6th Grade |
| Scandinavians | 100.0 /100 | #28 | Exceptional 98.0% |
| French | 100.0 /100 | #29 | Exceptional 98.0% |
| French Canadians | 100.0 /100 | #30 | Exceptional 98.0% |
| Europeans | 100.0 /100 | #31 | Exceptional 98.0% |
| Alaska Natives | 100.0 /100 | #32 | Exceptional 98.0% |
| Chippewa | 100.0 /100 | #33 | Exceptional 97.9% |
| Swiss | 100.0 /100 | #34 | Exceptional 97.9% |
| Chinese | 100.0 /100 | #35 | Exceptional 97.9% |
| Italians | 100.0 /100 | #36 | Exceptional 97.9% |
| British | 100.0 /100 | #37 | Exceptional 97.9% |
| Belgians | 100.0 /100 | #38 | Exceptional 97.9% |
| Luxembourgers | 99.9 /100 | #39 | Exceptional 97.9% |
| Latvians | 99.9 /100 | #40 | Exceptional 97.9% |
| Eastern Europeans | 99.9 /100 | #41 | Exceptional 97.9% |
| Hungarians | 99.9 /100 | #42 | Exceptional 97.8% |
Demographics Similar to Immigrants from Uzbekistan by 6th Grade
In terms of 6th grade, the demographic groups most similar to Immigrants from Uzbekistan are West Indian (96.3%, a difference of 0.0%), Immigrants from South America (96.3%, a difference of 0.010%), Immigrants from Hong Kong (96.3%, a difference of 0.010%), Afghan (96.4%, a difference of 0.020%), and Ghanaian (96.4%, a difference of 0.030%).
| Demographics | Rating | Rank | 6th Grade |
| Immigrants | Sierra Leone | 0.4 /100 | #261 | Tragic 96.4% |
| Immigrants | Nigeria | 0.3 /100 | #262 | Tragic 96.4% |
| Immigrants | Colombia | 0.3 /100 | #263 | Tragic 96.4% |
| Armenians | 0.3 /100 | #264 | Tragic 96.4% |
| Immigrants | Jamaica | 0.2 /100 | #265 | Tragic 96.4% |
| Ghanaians | 0.2 /100 | #266 | Tragic 96.4% |
| Afghans | 0.2 /100 | #267 | Tragic 96.4% |
| Immigrants | Uzbekistan | 0.2 /100 | #268 | Tragic 96.3% |
| West Indians | 0.2 /100 | #269 | Tragic 96.3% |
| Immigrants | South America | 0.2 /100 | #270 | Tragic 96.3% |
| Immigrants | Hong Kong | 0.2 /100 | #271 | Tragic 96.3% |
| Immigrants | Bolivia | 0.1 /100 | #272 | Tragic 96.3% |
| Immigrants | Cameroon | 0.1 /100 | #273 | Tragic 96.3% |
| Immigrants | Philippines | 0.1 /100 | #274 | Tragic 96.3% |
| Immigrants | Ghana | 0.1 /100 | #275 | Tragic 96.3% |