Chilean vs Immigrants from Africa 5th Grade
COMPARE
Chilean
Immigrants from Africa
5th Grade
5th Grade Comparison
Chileans
Immigrants from Africa
97.3%
5TH GRADE
54.5/ 100
METRIC RATING
168th/ 347
METRIC RANK
96.9%
5TH GRADE
1.1/ 100
METRIC RATING
247th/ 347
METRIC RANK
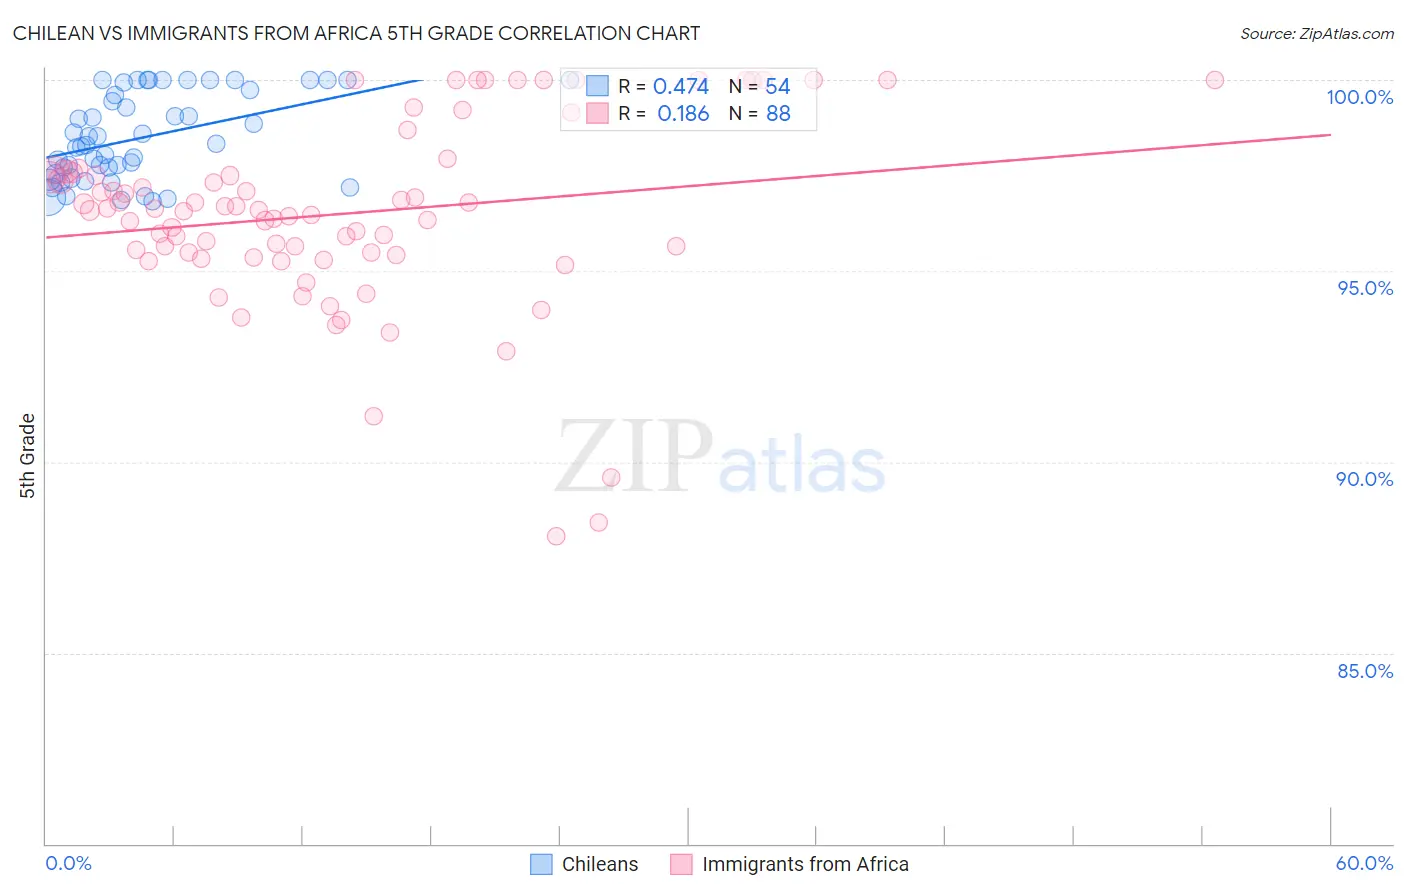
Chilean vs Immigrants from Africa 5th Grade Correlation Chart
The statistical analysis conducted on geographies consisting of 256,683,580 people shows a moderate positive correlation between the proportion of Chileans and percentage of population with at least 5th grade education in the United States with a correlation coefficient (R) of 0.474 and weighted average of 97.3%. Similarly, the statistical analysis conducted on geographies consisting of 469,408,495 people shows a poor positive correlation between the proportion of Immigrants from Africa and percentage of population with at least 5th grade education in the United States with a correlation coefficient (R) of 0.186 and weighted average of 96.9%, a difference of 0.49%.
5th Grade Correlation Summary
| Measurement | Chilean | Immigrants from Africa |
| Minimum | 96.8% | 88.1% |
| Maximum | 100.0% | 100.0% |
| Range | 3.2% | 11.9% |
| Mean | 98.5% | 96.5% |
| Median | 98.3% | 96.6% |
| Interquartile 25% (IQ1) | 97.5% | 95.4% |
| Interquartile 75% (IQ3) | 99.8% | 97.6% |
| Interquartile Range (IQR) | 2.2% | 2.1% |
| Standard Deviation (Sample) | 1.1% | 2.4% |
| Standard Deviation (Population) | 1.1% | 2.4% |
Similar Demographics by 5th Grade
Demographics Similar to Chileans by 5th Grade
In terms of 5th grade, the demographic groups most similar to Chileans are Immigrants from Belarus (97.3%, a difference of 0.0%), Immigrants from Korea (97.3%, a difference of 0.0%), Venezuelan (97.3%, a difference of 0.0%), Immigrants from Sri Lanka (97.3%, a difference of 0.0%), and Arab (97.3%, a difference of 0.0%).
| Demographics | Rating | Rank | 5th Grade |
| Kenyans | 59.7 /100 | #161 | Average 97.4% |
| Immigrants | Iran | 59.5 /100 | #162 | Average 97.4% |
| Ugandans | 58.9 /100 | #163 | Average 97.4% |
| Bermudans | 58.8 /100 | #164 | Average 97.4% |
| Immigrants | Poland | 57.9 /100 | #165 | Average 97.4% |
| Apache | 57.2 /100 | #166 | Average 97.4% |
| Immigrants | Belarus | 54.6 /100 | #167 | Average 97.3% |
| Chileans | 54.5 /100 | #168 | Average 97.3% |
| Immigrants | Korea | 54.1 /100 | #169 | Average 97.3% |
| Venezuelans | 54.0 /100 | #170 | Average 97.3% |
| Immigrants | Sri Lanka | 53.8 /100 | #171 | Average 97.3% |
| Arabs | 53.4 /100 | #172 | Average 97.3% |
| Egyptians | 52.4 /100 | #173 | Average 97.3% |
| Immigrants | Kazakhstan | 50.0 /100 | #174 | Average 97.3% |
| Immigrants | Micronesia | 48.8 /100 | #175 | Average 97.3% |
Demographics Similar to Immigrants from Africa by 5th Grade
In terms of 5th grade, the demographic groups most similar to Immigrants from Africa are U.S. Virgin Islander (96.9%, a difference of 0.0%), Ethiopian (96.9%, a difference of 0.010%), Immigrants from Uruguay (96.9%, a difference of 0.010%), Immigrants from Liberia (96.9%, a difference of 0.010%), and Bolivian (96.9%, a difference of 0.010%).
| Demographics | Rating | Rank | 5th Grade |
| Indians (Asian) | 1.9 /100 | #240 | Tragic 96.9% |
| Immigrants | Asia | 1.7 /100 | #241 | Tragic 96.9% |
| Immigrants | Costa Rica | 1.6 /100 | #242 | Tragic 96.9% |
| Immigrants | Eastern Africa | 1.6 /100 | #243 | Tragic 96.9% |
| Koreans | 1.6 /100 | #244 | Tragic 96.9% |
| Colombians | 1.3 /100 | #245 | Tragic 96.9% |
| Ethiopians | 1.2 /100 | #246 | Tragic 96.9% |
| Immigrants | Africa | 1.1 /100 | #247 | Tragic 96.9% |
| U.S. Virgin Islanders | 1.1 /100 | #248 | Tragic 96.9% |
| Immigrants | Uruguay | 1.0 /100 | #249 | Tragic 96.9% |
| Immigrants | Liberia | 1.0 /100 | #250 | Tragic 96.9% |
| Bolivians | 0.9 /100 | #251 | Tragic 96.9% |
| Jamaicans | 0.9 /100 | #252 | Tragic 96.9% |
| Immigrants | Middle Africa | 0.8 /100 | #253 | Tragic 96.8% |
| Immigrants | Senegal | 0.8 /100 | #254 | Tragic 96.8% |