Chilean vs Guyanese Master's Degree
COMPARE
Chilean
Guyanese
Master's Degree
Master's Degree Comparison
Chileans
Guyanese
16.9%
MASTER'S DEGREE
98.6/ 100
METRIC RATING
102nd/ 347
METRIC RANK
13.7%
MASTER'S DEGREE
7.6/ 100
METRIC RATING
231st/ 347
METRIC RANK
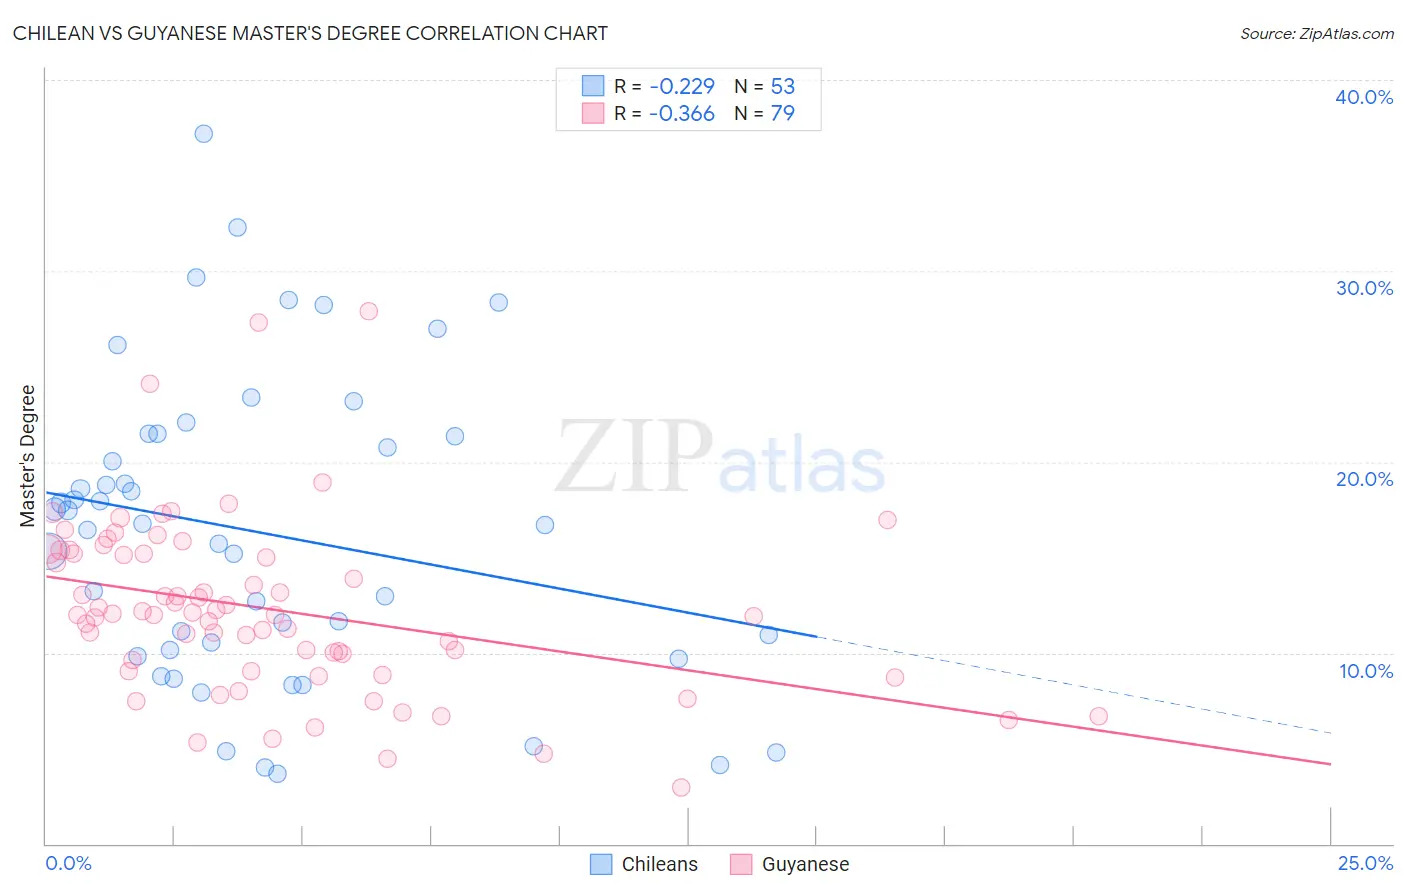
Chilean vs Guyanese Master's Degree Correlation Chart
The statistical analysis conducted on geographies consisting of 256,643,247 people shows a weak negative correlation between the proportion of Chileans and percentage of population with at least master's degree education in the United States with a correlation coefficient (R) of -0.229 and weighted average of 16.9%. Similarly, the statistical analysis conducted on geographies consisting of 176,878,343 people shows a mild negative correlation between the proportion of Guyanese and percentage of population with at least master's degree education in the United States with a correlation coefficient (R) of -0.366 and weighted average of 13.7%, a difference of 23.4%.
Master's Degree Correlation Summary
| Measurement | Chilean | Guyanese |
| Minimum | 3.6% | 3.0% |
| Maximum | 37.2% | 27.9% |
| Range | 33.5% | 24.9% |
| Mean | 16.3% | 12.3% |
| Median | 16.7% | 12.0% |
| Interquartile 25% (IQ1) | 10.0% | 9.0% |
| Interquartile 75% (IQ3) | 21.4% | 15.2% |
| Interquartile Range (IQR) | 11.4% | 6.2% |
| Standard Deviation (Sample) | 7.9% | 4.6% |
| Standard Deviation (Population) | 7.8% | 4.6% |
Similar Demographics by Master's Degree
Demographics Similar to Chileans by Master's Degree
In terms of master's degree, the demographic groups most similar to Chileans are Immigrants from Nepal (17.0%, a difference of 0.080%), Albanian (17.0%, a difference of 0.26%), Alsatian (16.9%, a difference of 0.33%), Ukrainian (16.9%, a difference of 0.45%), and Laotian (17.0%, a difference of 0.47%).
| Demographics | Rating | Rank | Master's Degree |
| Immigrants | Morocco | 98.9 /100 | #95 | Exceptional 17.1% |
| Immigrants | Northern Africa | 98.9 /100 | #96 | Exceptional 17.1% |
| Immigrants | England | 98.8 /100 | #97 | Exceptional 17.0% |
| Immigrants | Ukraine | 98.8 /100 | #98 | Exceptional 17.0% |
| Laotians | 98.8 /100 | #99 | Exceptional 17.0% |
| Albanians | 98.7 /100 | #100 | Exceptional 17.0% |
| Immigrants | Nepal | 98.6 /100 | #101 | Exceptional 17.0% |
| Chileans | 98.6 /100 | #102 | Exceptional 16.9% |
| Alsatians | 98.4 /100 | #103 | Exceptional 16.9% |
| Ukrainians | 98.3 /100 | #104 | Exceptional 16.9% |
| Syrians | 98.3 /100 | #105 | Exceptional 16.8% |
| Immigrants | Albania | 98.1 /100 | #106 | Exceptional 16.8% |
| Armenians | 98.0 /100 | #107 | Exceptional 16.8% |
| Sierra Leoneans | 98.0 /100 | #108 | Exceptional 16.8% |
| Moroccans | 98.0 /100 | #109 | Exceptional 16.8% |
Demographics Similar to Guyanese by Master's Degree
In terms of master's degree, the demographic groups most similar to Guyanese are Dutch (13.8%, a difference of 0.55%), British West Indian (13.8%, a difference of 0.58%), White/Caucasian (13.8%, a difference of 0.68%), Immigrants from Philippines (13.6%, a difference of 0.88%), and Immigrants from West Indies (13.9%, a difference of 1.0%).
| Demographics | Rating | Rank | Master's Degree |
| Immigrants | Grenada | 11.8 /100 | #224 | Poor 14.0% |
| Portuguese | 11.2 /100 | #225 | Poor 13.9% |
| Immigrants | St. Vincent and the Grenadines | 11.0 /100 | #226 | Poor 13.9% |
| Immigrants | West Indies | 9.8 /100 | #227 | Tragic 13.9% |
| Whites/Caucasians | 9.1 /100 | #228 | Tragic 13.8% |
| British West Indians | 8.8 /100 | #229 | Tragic 13.8% |
| Dutch | 8.7 /100 | #230 | Tragic 13.8% |
| Guyanese | 7.6 /100 | #231 | Tragic 13.7% |
| Immigrants | Philippines | 6.0 /100 | #232 | Tragic 13.6% |
| Immigrants | Ecuador | 5.7 /100 | #233 | Tragic 13.6% |
| Immigrants | Burma/Myanmar | 5.0 /100 | #234 | Tragic 13.5% |
| German Russians | 4.5 /100 | #235 | Tragic 13.5% |
| Immigrants | Guyana | 4.4 /100 | #236 | Tragic 13.4% |
| Jamaicans | 4.1 /100 | #237 | Tragic 13.4% |
| Hmong | 4.0 /100 | #238 | Tragic 13.4% |