Cheyenne vs White/Caucasian High School Diploma
COMPARE
Cheyenne
White/Caucasian
High School Diploma
High School Diploma Comparison
Cheyenne
Whites/Caucasians
87.8%
HIGH SCHOOL DIPLOMA
2.1/ 100
METRIC RATING
242nd/ 347
METRIC RANK
90.1%
HIGH SCHOOL DIPLOMA
94.1/ 100
METRIC RATING
121st/ 347
METRIC RANK
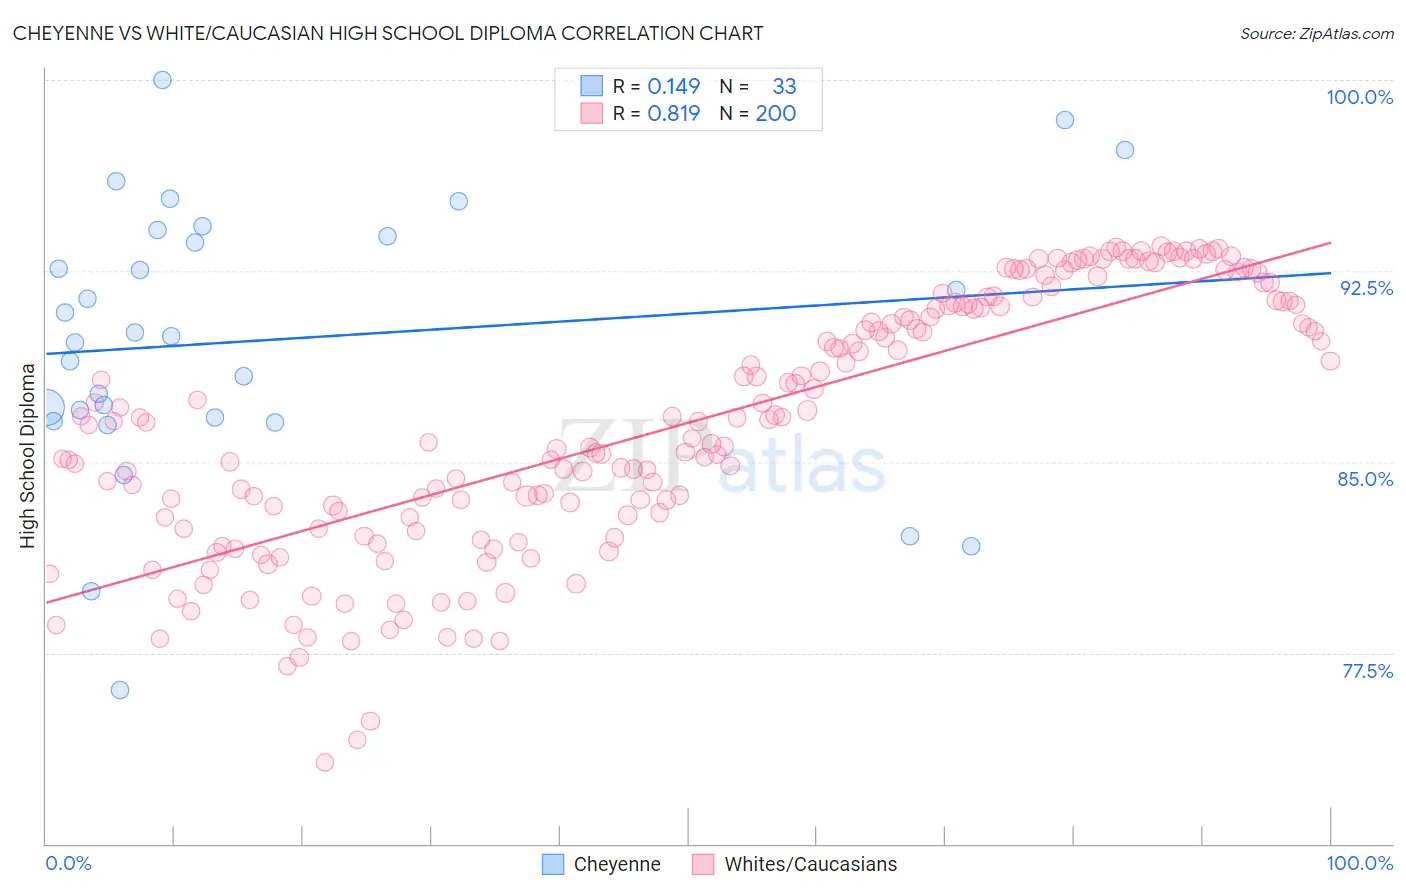
Cheyenne vs White/Caucasian High School Diploma Correlation Chart
The statistical analysis conducted on geographies consisting of 80,719,287 people shows a poor positive correlation between the proportion of Cheyenne and percentage of population with at least high school diploma education in the United States with a correlation coefficient (R) of 0.149 and weighted average of 87.8%. Similarly, the statistical analysis conducted on geographies consisting of 585,242,062 people shows a very strong positive correlation between the proportion of Whites/Caucasians and percentage of population with at least high school diploma education in the United States with a correlation coefficient (R) of 0.819 and weighted average of 90.1%, a difference of 2.5%.
High School Diploma Correlation Summary
| Measurement | Cheyenne | White/Caucasian |
| Minimum | 76.1% | 73.2% |
| Maximum | 100.0% | 93.5% |
| Range | 23.9% | 20.3% |
| Mean | 89.8% | 86.5% |
| Median | 90.0% | 86.6% |
| Interquartile 25% (IQ1) | 86.7% | 82.9% |
| Interquartile 75% (IQ3) | 94.0% | 91.2% |
| Interquartile Range (IQR) | 7.3% | 8.3% |
| Standard Deviation (Sample) | 5.4% | 5.0% |
| Standard Deviation (Population) | 5.3% | 5.0% |
Similar Demographics by High School Diploma
Demographics Similar to Cheyenne by High School Diploma
In terms of high school diploma, the demographic groups most similar to Cheyenne are Immigrants from Uzbekistan (87.8%, a difference of 0.0%), Immigrants from Philippines (87.8%, a difference of 0.020%), Comanche (87.9%, a difference of 0.030%), Choctaw (87.8%, a difference of 0.030%), and Peruvian (87.8%, a difference of 0.040%).
| Demographics | Rating | Rank | High School Diploma |
| Immigrants | Bahamas | 2.9 /100 | #235 | Tragic 88.0% |
| Sub-Saharan Africans | 2.8 /100 | #236 | Tragic 87.9% |
| Taiwanese | 2.8 /100 | #237 | Tragic 87.9% |
| Sioux | 2.7 /100 | #238 | Tragic 87.9% |
| South Americans | 2.7 /100 | #239 | Tragic 87.9% |
| Comanche | 2.2 /100 | #240 | Tragic 87.9% |
| Immigrants | Uzbekistan | 2.1 /100 | #241 | Tragic 87.8% |
| Cheyenne | 2.1 /100 | #242 | Tragic 87.8% |
| Immigrants | Philippines | 1.9 /100 | #243 | Tragic 87.8% |
| Choctaw | 1.9 /100 | #244 | Tragic 87.8% |
| Peruvians | 1.9 /100 | #245 | Tragic 87.8% |
| Immigrants | Eritrea | 1.7 /100 | #246 | Tragic 87.8% |
| Immigrants | Costa Rica | 1.7 /100 | #247 | Tragic 87.8% |
| Spanish Americans | 1.5 /100 | #248 | Tragic 87.7% |
| Senegalese | 1.5 /100 | #249 | Tragic 87.7% |
Demographics Similar to Whites/Caucasians by High School Diploma
In terms of high school diploma, the demographic groups most similar to Whites/Caucasians are Ottawa (90.1%, a difference of 0.020%), Immigrants from Kazakhstan (90.0%, a difference of 0.050%), Immigrants from Eastern Europe (90.1%, a difference of 0.060%), Israeli (90.1%, a difference of 0.070%), and Jordanian (90.2%, a difference of 0.10%).
| Demographics | Rating | Rank | High School Diploma |
| Yugoslavians | 96.2 /100 | #114 | Exceptional 90.2% |
| Immigrants | Hungary | 95.8 /100 | #115 | Exceptional 90.2% |
| Immigrants | Germany | 95.7 /100 | #116 | Exceptional 90.2% |
| Jordanians | 95.4 /100 | #117 | Exceptional 90.2% |
| Israelis | 95.1 /100 | #118 | Exceptional 90.1% |
| Immigrants | Eastern Europe | 94.9 /100 | #119 | Exceptional 90.1% |
| Ottawa | 94.4 /100 | #120 | Exceptional 90.1% |
| Whites/Caucasians | 94.1 /100 | #121 | Exceptional 90.1% |
| Immigrants | Kazakhstan | 93.4 /100 | #122 | Exceptional 90.0% |
| German Russians | 92.0 /100 | #123 | Exceptional 90.0% |
| Mongolians | 91.6 /100 | #124 | Exceptional 89.9% |
| Egyptians | 91.1 /100 | #125 | Exceptional 89.9% |
| Alaska Natives | 91.0 /100 | #126 | Exceptional 89.9% |
| Immigrants | Eastern Asia | 89.2 /100 | #127 | Excellent 89.9% |
| Puget Sound Salish | 89.1 /100 | #128 | Excellent 89.9% |