Cheyenne vs French American Indian 10th Grade
COMPARE
Cheyenne
French American Indian
10th Grade
10th Grade Comparison
Cheyenne
French American Indians
93.5%
10TH GRADE
26.8/ 100
METRIC RATING
195th/ 347
METRIC RANK
93.7%
10TH GRADE
50.9/ 100
METRIC RATING
172nd/ 347
METRIC RANK
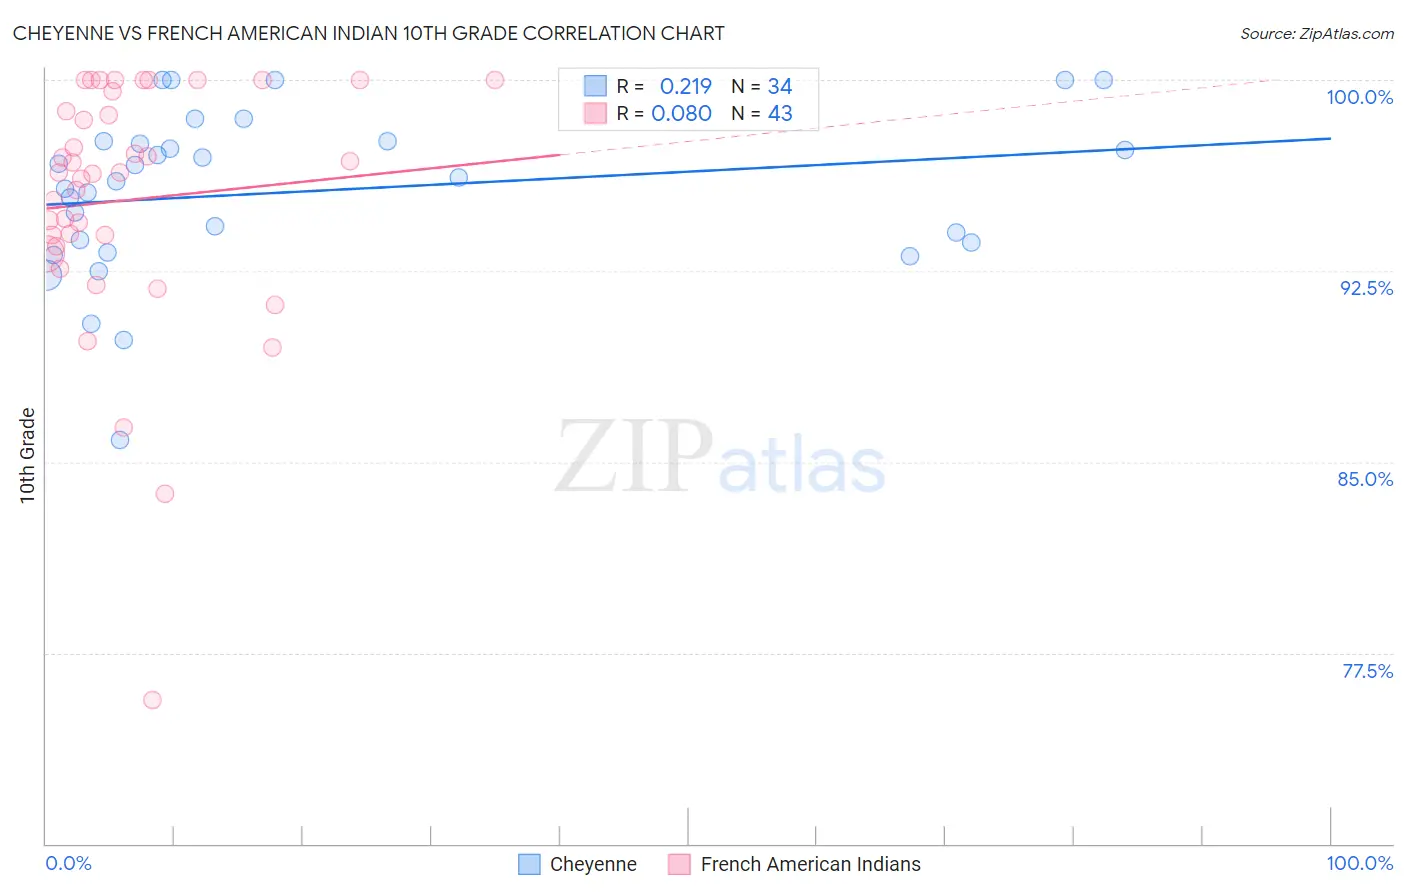
Cheyenne vs French American Indian 10th Grade Correlation Chart
The statistical analysis conducted on geographies consisting of 80,719,411 people shows a weak positive correlation between the proportion of Cheyenne and percentage of population with at least 10th grade education in the United States with a correlation coefficient (R) of 0.219 and weighted average of 93.5%. Similarly, the statistical analysis conducted on geographies consisting of 131,976,269 people shows a slight positive correlation between the proportion of French American Indians and percentage of population with at least 10th grade education in the United States with a correlation coefficient (R) of 0.080 and weighted average of 93.7%, a difference of 0.23%.
10th Grade Correlation Summary
| Measurement | Cheyenne | French American Indian |
| Minimum | 85.8% | 75.6% |
| Maximum | 100.0% | 100.0% |
| Range | 14.2% | 24.4% |
| Mean | 95.6% | 95.3% |
| Median | 96.1% | 96.3% |
| Interquartile 25% (IQ1) | 93.6% | 93.5% |
| Interquartile 75% (IQ3) | 97.6% | 99.6% |
| Interquartile Range (IQR) | 4.0% | 6.1% |
| Standard Deviation (Sample) | 3.2% | 4.9% |
| Standard Deviation (Population) | 3.2% | 4.9% |
Similar Demographics by 10th Grade
Demographics Similar to Cheyenne by 10th Grade
In terms of 10th grade, the demographic groups most similar to Cheyenne are Immigrants from Morocco (93.5%, a difference of 0.0%), Immigrants from Malaysia (93.5%, a difference of 0.010%), Panamanian (93.5%, a difference of 0.010%), Moroccan (93.5%, a difference of 0.020%), and Pueblo (93.5%, a difference of 0.030%).
| Demographics | Rating | Rank | 10th Grade |
| Marshallese | 33.2 /100 | #188 | Fair 93.6% |
| Immigrants | Pakistan | 32.5 /100 | #189 | Fair 93.6% |
| Laotians | 32.1 /100 | #190 | Fair 93.6% |
| Yup'ik | 31.1 /100 | #191 | Fair 93.6% |
| Immigrants | Malaysia | 28.0 /100 | #192 | Fair 93.5% |
| Panamanians | 28.0 /100 | #193 | Fair 93.5% |
| Immigrants | Morocco | 26.9 /100 | #194 | Fair 93.5% |
| Cheyenne | 26.8 /100 | #195 | Fair 93.5% |
| Moroccans | 25.3 /100 | #196 | Fair 93.5% |
| Pueblo | 23.9 /100 | #197 | Fair 93.5% |
| Immigrants | Micronesia | 23.2 /100 | #198 | Fair 93.5% |
| Asians | 23.0 /100 | #199 | Fair 93.5% |
| Hopi | 22.2 /100 | #200 | Fair 93.5% |
| Hawaiians | 21.8 /100 | #201 | Fair 93.5% |
| Immigrants | Uganda | 20.9 /100 | #202 | Fair 93.5% |
Demographics Similar to French American Indians by 10th Grade
In terms of 10th grade, the demographic groups most similar to French American Indians are Immigrants from Albania (93.8%, a difference of 0.010%), Spaniard (93.7%, a difference of 0.010%), Argentinean (93.7%, a difference of 0.010%), Immigrants from Nepal (93.7%, a difference of 0.010%), and Immigrants from Venezuela (93.8%, a difference of 0.030%).
| Demographics | Rating | Rank | 10th Grade |
| Brazilians | 63.6 /100 | #165 | Good 93.8% |
| Immigrants | Iraq | 63.0 /100 | #166 | Good 93.8% |
| Immigrants | Egypt | 62.3 /100 | #167 | Good 93.8% |
| Alsatians | 59.4 /100 | #168 | Average 93.8% |
| Immigrants | Spain | 55.9 /100 | #169 | Average 93.8% |
| Immigrants | Venezuela | 53.9 /100 | #170 | Average 93.8% |
| Immigrants | Albania | 52.4 /100 | #171 | Average 93.8% |
| French American Indians | 50.9 /100 | #172 | Average 93.7% |
| Spaniards | 50.3 /100 | #173 | Average 93.7% |
| Argentineans | 50.0 /100 | #174 | Average 93.7% |
| Immigrants | Nepal | 49.6 /100 | #175 | Average 93.7% |
| Immigrants | Argentina | 47.1 /100 | #176 | Average 93.7% |
| Immigrants | Lebanon | 47.1 /100 | #177 | Average 93.7% |
| Sierra Leoneans | 46.1 /100 | #178 | Average 93.7% |
| Paraguayans | 45.3 /100 | #179 | Average 93.7% |