Cherokee vs Iraqi 2nd Grade

COMPARE

Cherokee
Race
Ancestry
AfghanAfricanAlaska NativeAlaskan AthabascanAlbanianAleutAlsatianAmericanApacheArabArapahoArgentineanArmenianAssyrian/Chaldean/SyriacAustralianAustrianBahamianBangladeshiBarbadianBasqueBelgianBelizeanBermudanBhutaneseBlackfeetBolivianBrazilianBritishBritish West IndianBulgarianBurmeseCajunCambodianCanadianCape VerdeanCarpatho RusynCelticCentral AmericanCentral American IndianCherokeeCheyenneChickasawChileanChineseChippewaChoctawColombianColvilleComancheCosta RicanCreeCreekCroatianCrowCubanCypriotCzechCzechoslovakianDanishDelawareDominicanDutchDutch West IndianEastern EuropeanEcuadorianEgyptianEnglishEstonianEthiopianEuropeanFijianFilipinoFinnishFrenchFrench American IndianFrench CanadianGermanGerman RussianGhanaianGreekGuamanian/ChamorroGuatemalanGuyaneseHaitianHmongHonduranHopiHoumaHungarianIcelanderIndian (Asian)IndonesianInupiatIranianIrishIroquoisIsraeliItalianJamaicanJapaneseJordanianKenyanKiowaKoreanLaotianLatvianLebaneseLiberianLithuanianLumbeeLuxembourgerMacedonianMalaysianMalteseMarshalleseMenomineeMexicanMexican American IndianMongolianMoroccanNative HawaiianNavajoNepaleseNew ZealanderNicaraguanNigerianNorthern EuropeanNorwegianOkinawanOsageOttawaPaiutePakistaniPalestinianPanamanianParaguayanPennsylvania GermanPeruvianPimaPolishPortuguesePotawatomiPuebloPuerto RicanPuget Sound SalishRomanianRussianSalvadoranSamoanScandinavianScotch-IrishScottishSeminoleSenegaleseSerbianShoshoneSierra LeoneanSiouxSlavicSlovakSloveneSomaliSouth AfricanSouth AmericanSouth American IndianSoviet UnionSpaniardSpanishSpanish AmericanSpanish American IndianSri LankanSubsaharan AfricanSudaneseSwedishSwissSyrianTaiwaneseThaiTlingit-HaidaTohono O'OdhamTonganTrinidadian and TobagonianTsimshianTurkishU.S. Virgin IslanderUgandanUkrainianUruguayanUteVenezuelanVietnameseWelshWest IndianYakamaYaquiYugoslavianYumanYup'ikZimbabwean
Immigration
NonimmigrantsImmigrantsAfghanistanAfricaAlbaniaArgentinaArmeniaAsiaAustraliaAustriaBahamasBangladeshBarbadosBelarusBelgiumBelizeBoliviaBosnia and HerzegovinaBrazilBulgariaBurma/MyanmarCabo VerdeCambodiaCameroonCanadaCaribbeanCentral AmericaChileChinaColombiaCongoCosta RicaCroatiaCubaCzechoslovakiaDenmarkDominicaDominican RepublicEastern AfricaEastern AsiaEastern EuropeEcuadorEgyptEl SalvadorEnglandEritreaEthiopiaEuropeFijiFranceGermanyGhanaGreeceGrenadaGuatemalaGuyanaHaitiHondurasHong KongHungaryIndiaIndonesiaIranIraqIrelandIsraelItalyJamaicaJapanJordanKazakhstanKenyaKoreaKuwaitLaosLatin AmericaLatviaLebanonLiberiaLithuaniaMalaysiaMexicoMicronesiaMiddle AfricaMoldovaMoroccoNepalNetherlandsNicaraguaNigeriaNorth AmericaNorth MacedoniaNorthern AfricaNorthern EuropeNorwayOceaniaPakistanPanamaPeruPhilippinesPolandPortugalRomaniaRussiaSaudi ArabiaScotlandSenegalSerbiaSierra LeoneSingaporeSomaliaSouth AfricaSouth AmericaSouth Central AsiaSouth Eastern AsiaSouthern EuropeSpainSri LankaSt. Vincent and the GrenadinesSudanSwedenSwitzerlandSyriaTaiwanThailandTrinidad and TobagoTurkeyUgandaUkraineUruguayUzbekistanVenezuelaVietnamWest IndiesWestern AfricaWestern AsiaWestern EuropeYemenZaireZimbabweAzores
Iraqi
Race
Ancestry
AfghanAfricanAlaska NativeAlaskan AthabascanAlbanianAleutAlsatianAmericanApacheArabArapahoArgentineanArmenianAssyrian/Chaldean/SyriacAustralianAustrianBahamianBangladeshiBarbadianBasqueBelgianBelizeanBermudanBhutaneseBlackfeetBolivianBrazilianBritishBritish West IndianBulgarianBurmeseCajunCambodianCanadianCape VerdeanCarpatho RusynCelticCentral AmericanCentral American IndianCheyenneChickasawChileanChineseChippewaChoctawColombianColvilleComancheCosta RicanCreeCreekCroatianCrowCubanCypriotCzechCzechoslovakianDanishDelawareDominicanDutchDutch West IndianEastern EuropeanEcuadorianEgyptianEnglishEstonianEthiopianEuropeanFijianFilipinoFinnishFrenchFrench American IndianFrench CanadianGermanGerman RussianGhanaianGreekGuamanian/ChamorroGuatemalanGuyaneseHaitianHmongHonduranHopiHoumaHungarianIcelanderIndian (Asian)IndonesianInupiatIranianIraqiIrishIroquoisIsraeliItalianJamaicanJapaneseJordanianKenyanKiowaKoreanLaotianLatvianLebaneseLiberianLithuanianLumbeeLuxembourgerMacedonianMalaysianMalteseMarshalleseMenomineeMexicanMexican American IndianMongolianMoroccanNative HawaiianNavajoNepaleseNew ZealanderNicaraguanNigerianNorthern EuropeanNorwegianOkinawanOsageOttawaPaiutePakistaniPalestinianPanamanianParaguayanPennsylvania GermanPeruvianPimaPolishPortuguesePotawatomiPuebloPuerto RicanPuget Sound SalishRomanianRussianSalvadoranSamoanScandinavianScotch-IrishScottishSeminoleSenegaleseSerbianShoshoneSierra LeoneanSiouxSlavicSlovakSloveneSomaliSouth AfricanSouth AmericanSouth American IndianSoviet UnionSpaniardSpanishSpanish AmericanSpanish American IndianSri LankanSubsaharan AfricanSudaneseSwedishSwissSyrianTaiwaneseThaiTlingit-HaidaTohono O'OdhamTonganTrinidadian and TobagonianTsimshianTurkishU.S. Virgin IslanderUgandanUkrainianUruguayanUteVenezuelanVietnameseWelshWest IndianYakamaYaquiYugoslavianYumanYup'ikZimbabwean
Immigration
NonimmigrantsImmigrantsAfghanistanAfricaAlbaniaArgentinaArmeniaAsiaAustraliaAustriaBahamasBangladeshBarbadosBelarusBelgiumBelizeBoliviaBosnia and HerzegovinaBrazilBulgariaBurma/MyanmarCabo VerdeCambodiaCameroonCanadaCaribbeanCentral AmericaChileChinaColombiaCongoCosta RicaCroatiaCubaCzechoslovakiaDenmarkDominicaDominican RepublicEastern AfricaEastern AsiaEastern EuropeEcuadorEgyptEl SalvadorEnglandEritreaEthiopiaEuropeFijiFranceGermanyGhanaGreeceGrenadaGuatemalaGuyanaHaitiHondurasHong KongHungaryIndiaIndonesiaIranIraqIrelandIsraelItalyJamaicaJapanJordanKazakhstanKenyaKoreaKuwaitLaosLatin AmericaLatviaLebanonLiberiaLithuaniaMalaysiaMexicoMicronesiaMiddle AfricaMoldovaMoroccoNepalNetherlandsNicaraguaNigeriaNorth AmericaNorth MacedoniaNorthern AfricaNorthern EuropeNorwayOceaniaPakistanPanamaPeruPhilippinesPolandPortugalRomaniaRussiaSaudi ArabiaScotlandSenegalSerbiaSierra LeoneSingaporeSomaliaSouth AfricaSouth AmericaSouth Central AsiaSouth Eastern AsiaSouthern EuropeSpainSri LankaSt. Vincent and the GrenadinesSudanSwedenSwitzerlandSyriaTaiwanThailandTrinidad and TobagoTurkeyUgandaUkraineUruguayUzbekistanVenezuelaVietnamWest IndiesWestern AfricaWestern AsiaWestern EuropeYemenZaireZimbabweAzores
2nd Grade
Income
Poverty
Unemployment
Labor Participation
Family Structure
Vehicle Availability
Education Level
Disability

2nd Grade Comparison

Cherokee

Iraqis

Exceptional
Tragic
98.3%
2ND GRADE
99.4/ 100
METRIC RATING
76th/ 347
METRIC RANK
97.6%
2ND GRADE
4.6/ 100
METRIC RATING
221st/ 347
METRIC RANK

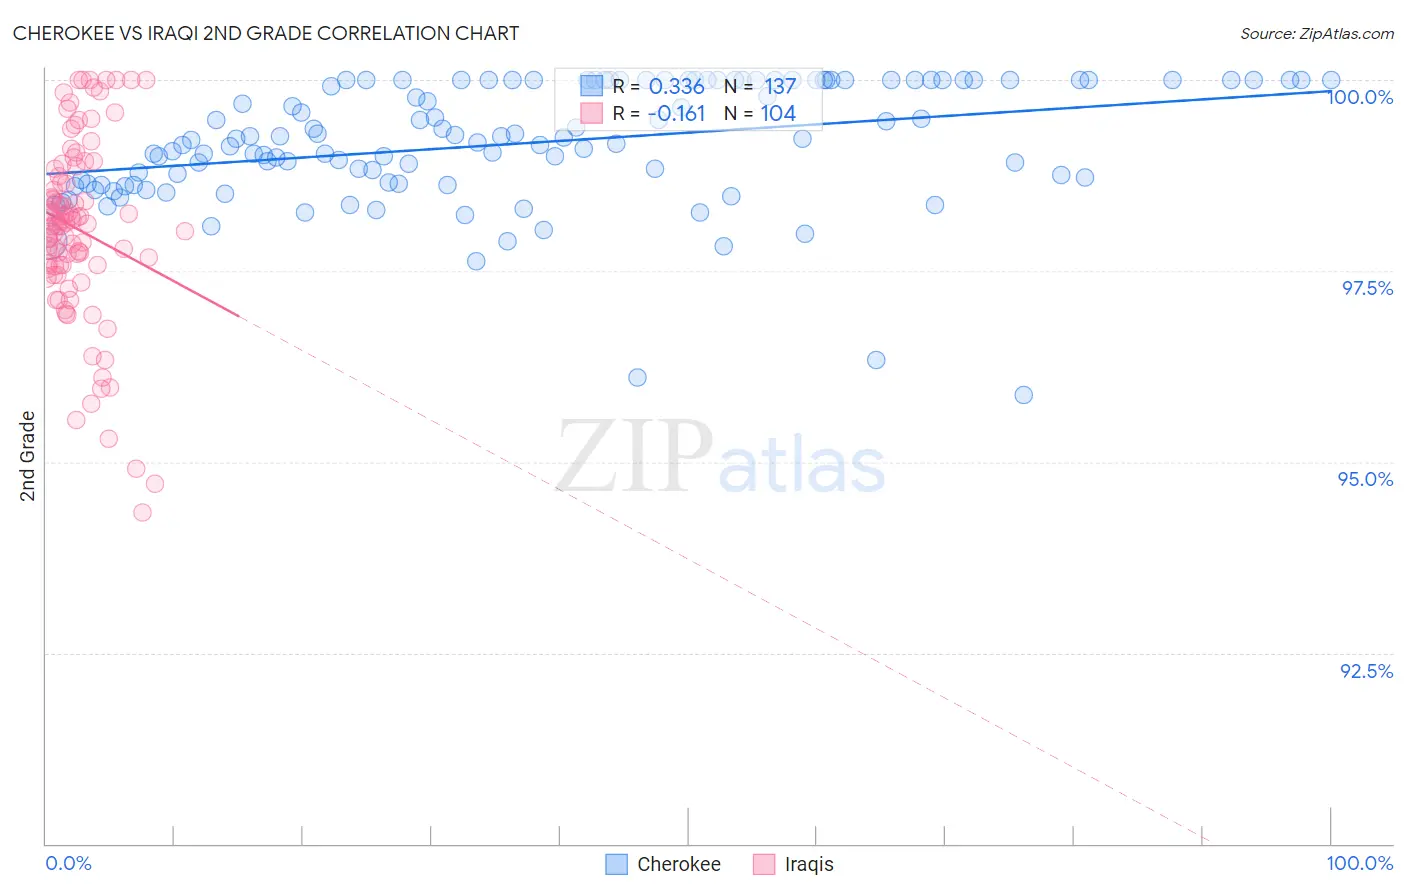
Cherokee vs Iraqi 2nd Grade Correlation Chart

The statistical analysis conducted on geographies consisting of 493,719,253 people shows a mild positive correlation between the proportion of Cherokee and percentage of population with at least 2nd grade education in the United States with a correlation coefficient (R) of 0.336 and weighted average of 98.3%. Similarly, the statistical analysis conducted on geographies consisting of 170,561,413 people shows a poor negative correlation between the proportion of Iraqis and percentage of population with at least 2nd grade education in the United States with a correlation coefficient (R) of -0.161 and weighted average of 97.6%, a difference of 0.64%.
Cherokee vs Iraqi 2nd Grade

2nd Grade Correlation Summary

MeasurementCherokeeIraqi
Minimum95.9%94.3%
Maximum100.0%100.0%
Range4.1%5.7%
Mean99.2%98.0%
Median99.2%98.1%
Interquartile 25% (IQ1)98.6%97.6%
Interquartile 75% (IQ3)100.0%98.8%
Interquartile Range (IQR)1.4%1.2%
Standard Deviation (Sample)0.80%1.2%
Standard Deviation (Population)0.80%1.2%

Similar Demographics by 2nd Grade

Demographics Similar to Cherokee by 2nd Grade

In terms of 2nd grade, the demographic groups most similar to Cherokee are Shoshone (98.3%, a difference of 0.0%), Immigrants from England (98.3%, a difference of 0.0%), Immigrants from Netherlands (98.3%, a difference of 0.010%), Immigrants from Lithuania (98.2%, a difference of 0.010%), and Immigrants from Belgium (98.2%, a difference of 0.010%).
DemographicsRating | Rank2nd Grade
Immigrants | Austria
99.6
/100
|
#69
Exceptional
98.3%
Serbians
99.6
/100
|
#70
Exceptional
98.3%
Chickasaw
99.6
/100
|
#71
Exceptional
98.3%
Cheyenne
99.6
/100
|
#72
Exceptional
98.3%
Cajuns
99.5
/100
|
#73
Exceptional
98.3%
Immigrants | Netherlands
99.4
/100
|
#74
Exceptional
98.3%
Shoshone
99.4
/100
|
#75
Exceptional
98.3%
Cherokee
99.4
/100
|
#76
Exceptional
98.3%
Immigrants | England
99.4
/100
|
#77
Exceptional
98.3%
Immigrants | Lithuania
99.3
/100
|
#78
Exceptional
98.2%
Immigrants | Belgium
99.3
/100
|
#79
Exceptional
98.2%
Osage
99.2
/100
|
#80
Exceptional
98.2%
Icelanders
99.2
/100
|
#81
Exceptional
98.2%
Delaware
99.1
/100
|
#82
Exceptional
98.2%
Immigrants | Sweden
99.1
/100
|
#83
Exceptional
98.2%

Demographics Similar to Iraqis by 2nd Grade

In terms of 2nd grade, the demographic groups most similar to Iraqis are Immigrants from Sudan (97.6%, a difference of 0.0%), Immigrants from Panama (97.6%, a difference of 0.010%), Immigrants from Morocco (97.6%, a difference of 0.010%), Sierra Leonean (97.6%, a difference of 0.010%), and Immigrants from Zaire (97.6%, a difference of 0.010%).
DemographicsRating | Rank2nd Grade
Samoans
7.1
/100
|
#214
Tragic
97.7%
Bahamians
6.8
/100
|
#215
Tragic
97.7%
South American Indians
6.7
/100
|
#216
Tragic
97.7%
Uruguayans
6.2
/100
|
#217
Tragic
97.7%
Sudanese
5.7
/100
|
#218
Tragic
97.7%
Immigrants | Panama
5.1
/100
|
#219
Tragic
97.6%
Immigrants | Morocco
5.0
/100
|
#220
Tragic
97.6%
Iraqis
4.6
/100
|
#221
Tragic
97.6%
Immigrants | Sudan
4.5
/100
|
#222
Tragic
97.6%
Sierra Leoneans
4.3
/100
|
#223
Tragic
97.6%
Immigrants | Zaire
4.3
/100
|
#224
Tragic
97.6%
Tongans
4.3
/100
|
#225
Tragic
97.6%
Immigrants | Syria
4.0
/100
|
#226
Tragic
97.6%
Immigrants | Nepal
4.0
/100
|
#227
Tragic
97.6%
Sub-Saharan Africans
3.4
/100
|
#228
Tragic
97.6%