Cherokee vs Immigrants from Ukraine Associate's Degree
COMPARE
Cherokee
Immigrants from Ukraine
Associate's Degree
Associate's Degree Comparison
Cherokee
Immigrants from Ukraine
38.9%
ASSOCIATE'S DEGREE
0.0/ 100
METRIC RATING
296th/ 347
METRIC RANK
49.7%
ASSOCIATE'S DEGREE
98.0/ 100
METRIC RATING
97th/ 347
METRIC RANK
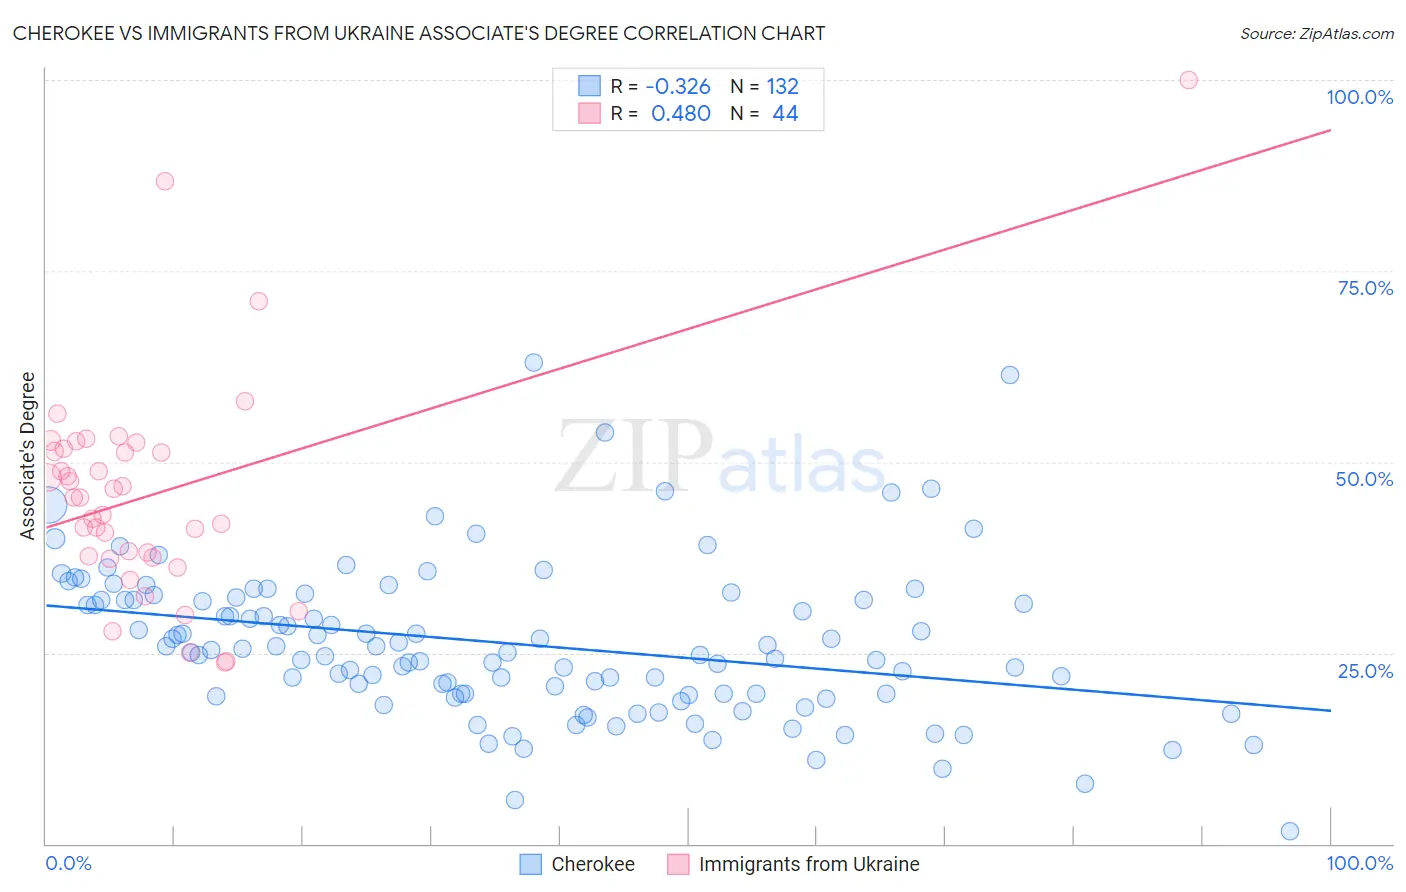
Cherokee vs Immigrants from Ukraine Associate's Degree Correlation Chart
The statistical analysis conducted on geographies consisting of 493,690,336 people shows a mild negative correlation between the proportion of Cherokee and percentage of population with at least associate's degree education in the United States with a correlation coefficient (R) of -0.326 and weighted average of 38.9%. Similarly, the statistical analysis conducted on geographies consisting of 289,711,904 people shows a moderate positive correlation between the proportion of Immigrants from Ukraine and percentage of population with at least associate's degree education in the United States with a correlation coefficient (R) of 0.480 and weighted average of 49.7%, a difference of 27.9%.
Associate's Degree Correlation Summary
| Measurement | Cherokee | Immigrants from Ukraine |
| Minimum | 1.6% | 23.7% |
| Maximum | 63.1% | 100.0% |
| Range | 61.4% | 76.3% |
| Mean | 26.2% | 45.7% |
| Median | 25.3% | 45.3% |
| Interquartile 25% (IQ1) | 19.6% | 37.5% |
| Interquartile 75% (IQ3) | 31.9% | 51.5% |
| Interquartile Range (IQR) | 12.3% | 14.0% |
| Standard Deviation (Sample) | 10.0% | 14.5% |
| Standard Deviation (Population) | 10.0% | 14.3% |
Similar Demographics by Associate's Degree
Demographics Similar to Cherokee by Associate's Degree
In terms of associate's degree, the demographic groups most similar to Cherokee are Honduran (38.9%, a difference of 0.17%), Cape Verdean (38.8%, a difference of 0.28%), Nepalese (39.0%, a difference of 0.46%), Salvadoran (39.0%, a difference of 0.46%), and Cheyenne (38.7%, a difference of 0.55%).
| Demographics | Rating | Rank | Associate's Degree |
| Central Americans | 0.0 /100 | #289 | Tragic 39.4% |
| Immigrants | Haiti | 0.0 /100 | #290 | Tragic 39.3% |
| Dominicans | 0.0 /100 | #291 | Tragic 39.3% |
| Blacks/African Americans | 0.0 /100 | #292 | Tragic 39.1% |
| Nepalese | 0.0 /100 | #293 | Tragic 39.0% |
| Salvadorans | 0.0 /100 | #294 | Tragic 39.0% |
| Hondurans | 0.0 /100 | #295 | Tragic 38.9% |
| Cherokee | 0.0 /100 | #296 | Tragic 38.9% |
| Cape Verdeans | 0.0 /100 | #297 | Tragic 38.8% |
| Cheyenne | 0.0 /100 | #298 | Tragic 38.7% |
| Ute | 0.0 /100 | #299 | Tragic 38.6% |
| Chickasaw | 0.0 /100 | #300 | Tragic 38.6% |
| Tsimshian | 0.0 /100 | #301 | Tragic 38.6% |
| Colville | 0.0 /100 | #302 | Tragic 38.5% |
| Guatemalans | 0.0 /100 | #303 | Tragic 38.5% |
Demographics Similar to Immigrants from Ukraine by Associate's Degree
In terms of associate's degree, the demographic groups most similar to Immigrants from Ukraine are Romanian (49.7%, a difference of 0.0%), Immigrants from England (49.7%, a difference of 0.020%), Immigrants from Northern Africa (49.7%, a difference of 0.090%), Macedonian (49.6%, a difference of 0.16%), and Immigrants from Nepal (49.5%, a difference of 0.38%).
| Demographics | Rating | Rank | Associate's Degree |
| Immigrants | Ethiopia | 98.7 /100 | #90 | Exceptional 50.1% |
| Immigrants | Western Asia | 98.7 /100 | #91 | Exceptional 50.1% |
| Immigrants | North America | 98.7 /100 | #92 | Exceptional 50.1% |
| Immigrants | Brazil | 98.5 /100 | #93 | Exceptional 50.0% |
| Laotians | 98.4 /100 | #94 | Exceptional 49.9% |
| Immigrants | England | 98.0 /100 | #95 | Exceptional 49.7% |
| Romanians | 98.0 /100 | #96 | Exceptional 49.7% |
| Immigrants | Ukraine | 98.0 /100 | #97 | Exceptional 49.7% |
| Immigrants | Northern Africa | 97.9 /100 | #98 | Exceptional 49.7% |
| Macedonians | 97.8 /100 | #99 | Exceptional 49.6% |
| Immigrants | Nepal | 97.5 /100 | #100 | Exceptional 49.5% |
| Northern Europeans | 97.3 /100 | #101 | Exceptional 49.5% |
| Chileans | 97.3 /100 | #102 | Exceptional 49.4% |
| Ukrainians | 97.1 /100 | #103 | Exceptional 49.4% |
| Venezuelans | 97.0 /100 | #104 | Exceptional 49.4% |