Central American vs Japanese Bachelor's Degree
COMPARE
Central American
Japanese
Bachelor's Degree
Bachelor's Degree Comparison
Central Americans
Japanese
31.9%
BACHELOR'S DEGREE
0.2/ 100
METRIC RATING
271st/ 347
METRIC RANK
33.3%
BACHELOR'S DEGREE
0.7/ 100
METRIC RATING
251st/ 347
METRIC RANK
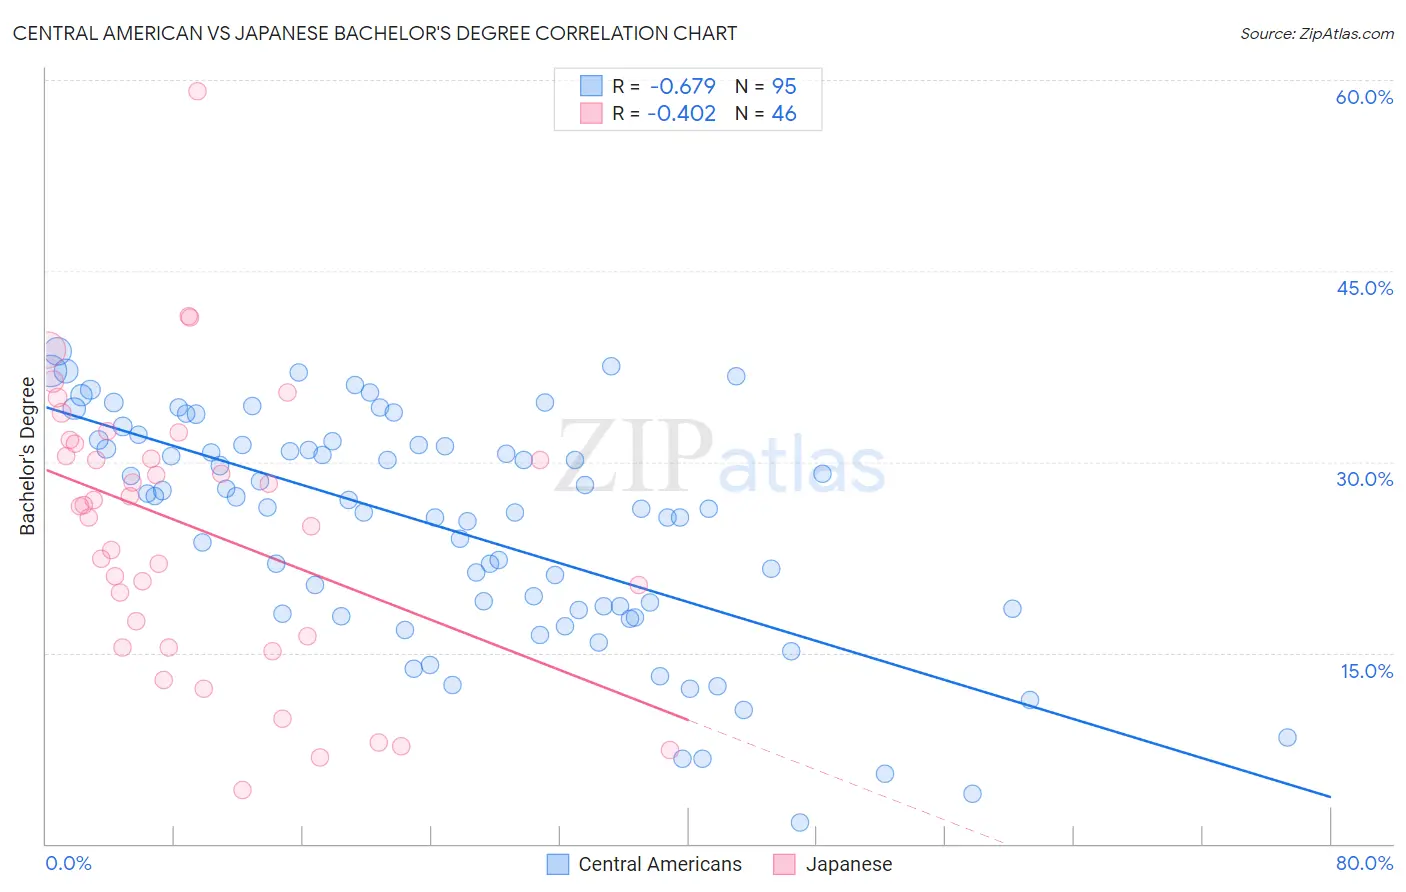
Central American vs Japanese Bachelor's Degree Correlation Chart
The statistical analysis conducted on geographies consisting of 504,521,400 people shows a significant negative correlation between the proportion of Central Americans and percentage of population with at least bachelor's degree education in the United States with a correlation coefficient (R) of -0.679 and weighted average of 31.9%. Similarly, the statistical analysis conducted on geographies consisting of 249,171,435 people shows a moderate negative correlation between the proportion of Japanese and percentage of population with at least bachelor's degree education in the United States with a correlation coefficient (R) of -0.402 and weighted average of 33.3%, a difference of 4.4%.
Bachelor's Degree Correlation Summary
| Measurement | Central American | Japanese |
| Minimum | 1.7% | 4.3% |
| Maximum | 38.7% | 59.2% |
| Range | 37.0% | 54.9% |
| Mean | 24.8% | 24.8% |
| Median | 26.5% | 26.5% |
| Interquartile 25% (IQ1) | 18.4% | 16.3% |
| Interquartile 75% (IQ3) | 31.3% | 31.5% |
| Interquartile Range (IQR) | 12.9% | 15.1% |
| Standard Deviation (Sample) | 8.9% | 11.0% |
| Standard Deviation (Population) | 8.8% | 10.8% |
Demographics Similar to Central Americans and Japanese by Bachelor's Degree
In terms of bachelor's degree, the demographic groups most similar to Central Americans are Immigrants from Nicaragua (31.9%, a difference of 0.090%), Immigrants from Belize (32.1%, a difference of 0.63%), Immigrants from Portugal (32.2%, a difference of 1.0%), Cuban (32.5%, a difference of 1.8%), and Immigrants from Dominica (32.5%, a difference of 1.9%). Similarly, the demographic groups most similar to Japanese are Immigrants from Bahamas (33.3%, a difference of 0.070%), U.S. Virgin Islander (33.2%, a difference of 0.28%), Native Hawaiian (33.2%, a difference of 0.34%), Iroquois (33.2%, a difference of 0.36%), and Nicaraguan (33.1%, a difference of 0.54%).
| Demographics | Rating | Rank | Bachelor's Degree |
| Japanese | 0.7 /100 | #251 | Tragic 33.3% |
| Immigrants | Bahamas | 0.7 /100 | #252 | Tragic 33.3% |
| U.S. Virgin Islanders | 0.7 /100 | #253 | Tragic 33.2% |
| Native Hawaiians | 0.7 /100 | #254 | Tragic 33.2% |
| Iroquois | 0.7 /100 | #255 | Tragic 33.2% |
| Nicaraguans | 0.6 /100 | #256 | Tragic 33.1% |
| Spanish Americans | 0.6 /100 | #257 | Tragic 33.1% |
| French American Indians | 0.6 /100 | #258 | Tragic 33.1% |
| Osage | 0.5 /100 | #259 | Tragic 33.0% |
| Malaysians | 0.5 /100 | #260 | Tragic 32.9% |
| Africans | 0.5 /100 | #261 | Tragic 32.9% |
| Immigrants | Jamaica | 0.5 /100 | #262 | Tragic 32.9% |
| Belizeans | 0.4 /100 | #263 | Tragic 32.8% |
| Central American Indians | 0.3 /100 | #264 | Tragic 32.5% |
| Bahamians | 0.3 /100 | #265 | Tragic 32.5% |
| Immigrants | Dominica | 0.3 /100 | #266 | Tragic 32.5% |
| Cubans | 0.3 /100 | #267 | Tragic 32.5% |
| Immigrants | Portugal | 0.2 /100 | #268 | Tragic 32.2% |
| Immigrants | Belize | 0.2 /100 | #269 | Tragic 32.1% |
| Immigrants | Nicaragua | 0.2 /100 | #270 | Tragic 31.9% |
| Central Americans | 0.2 /100 | #271 | Tragic 31.9% |