Central American vs Immigrants from North America 7th Grade
COMPARE
Central American
Immigrants from North America
7th Grade
7th Grade Comparison
Central Americans
Immigrants from North America
92.1%
7TH GRADE
0.0/ 100
METRIC RATING
338th/ 347
METRIC RANK
96.9%
7TH GRADE
99.8/ 100
METRIC RATING
62nd/ 347
METRIC RANK
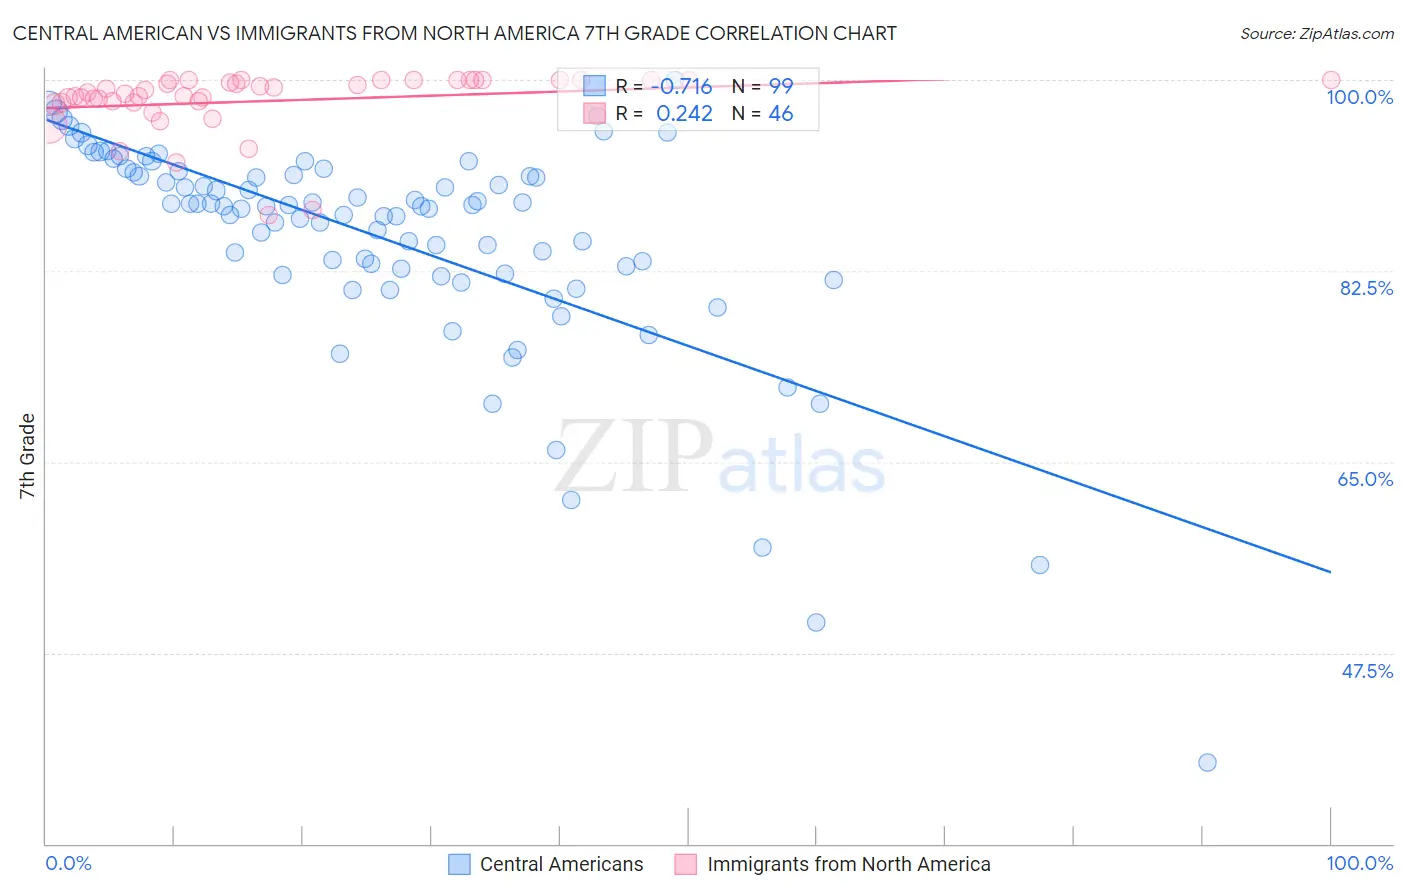
Central American vs Immigrants from North America 7th Grade Correlation Chart
The statistical analysis conducted on geographies consisting of 504,619,347 people shows a strong negative correlation between the proportion of Central Americans and percentage of population with at least 7th grade education in the United States with a correlation coefficient (R) of -0.716 and weighted average of 92.1%. Similarly, the statistical analysis conducted on geographies consisting of 462,462,330 people shows a weak positive correlation between the proportion of Immigrants from North America and percentage of population with at least 7th grade education in the United States with a correlation coefficient (R) of 0.242 and weighted average of 96.9%, a difference of 5.2%.
7th Grade Correlation Summary
| Measurement | Central American | Immigrants from North America |
| Minimum | 37.5% | 87.6% |
| Maximum | 100.0% | 100.0% |
| Range | 62.5% | 12.4% |
| Mean | 85.5% | 98.1% |
| Median | 88.4% | 98.8% |
| Interquartile 25% (IQ1) | 82.2% | 97.9% |
| Interquartile 75% (IQ3) | 91.5% | 100.0% |
| Interquartile Range (IQR) | 9.3% | 2.1% |
| Standard Deviation (Sample) | 10.2% | 2.8% |
| Standard Deviation (Population) | 10.1% | 2.8% |
Similar Demographics by 7th Grade
Demographics Similar to Central Americans by 7th Grade
In terms of 7th grade, the demographic groups most similar to Central Americans are Immigrants from Latin America (92.2%, a difference of 0.13%), Mexican (91.9%, a difference of 0.25%), Immigrants from Honduras (92.5%, a difference of 0.40%), Yakama (91.7%, a difference of 0.44%), and Guatemalan (91.7%, a difference of 0.46%).
| Demographics | Rating | Rank | 7th Grade |
| Hondurans | 0.0 /100 | #331 | Tragic 92.9% |
| Hispanics or Latinos | 0.0 /100 | #332 | Tragic 92.7% |
| Immigrants | Armenia | 0.0 /100 | #333 | Tragic 92.7% |
| Immigrants | Yemen | 0.0 /100 | #334 | Tragic 92.6% |
| Mexican American Indians | 0.0 /100 | #335 | Tragic 92.6% |
| Immigrants | Honduras | 0.0 /100 | #336 | Tragic 92.5% |
| Immigrants | Latin America | 0.0 /100 | #337 | Tragic 92.2% |
| Central Americans | 0.0 /100 | #338 | Tragic 92.1% |
| Mexicans | 0.0 /100 | #339 | Tragic 91.9% |
| Yakama | 0.0 /100 | #340 | Tragic 91.7% |
| Guatemalans | 0.0 /100 | #341 | Tragic 91.7% |
| Salvadorans | 0.0 /100 | #342 | Tragic 91.5% |
| Immigrants | Guatemala | 0.0 /100 | #343 | Tragic 91.3% |
| Immigrants | Central America | 0.0 /100 | #344 | Tragic 91.0% |
| Immigrants | El Salvador | 0.0 /100 | #345 | Tragic 90.9% |
Demographics Similar to Immigrants from North America by 7th Grade
In terms of 7th grade, the demographic groups most similar to Immigrants from North America are Immigrants from Canada (96.9%, a difference of 0.010%), Creek (96.9%, a difference of 0.010%), Immigrants from Northern Europe (96.9%, a difference of 0.010%), White/Caucasian (97.0%, a difference of 0.020%), and Macedonian (97.0%, a difference of 0.020%).
| Demographics | Rating | Rank | 7th Grade |
| Russians | 99.8 /100 | #55 | Exceptional 97.0% |
| Serbians | 99.8 /100 | #56 | Exceptional 97.0% |
| Americans | 99.8 /100 | #57 | Exceptional 97.0% |
| Whites/Caucasians | 99.8 /100 | #58 | Exceptional 97.0% |
| Macedonians | 99.8 /100 | #59 | Exceptional 97.0% |
| Immigrants | Canada | 99.8 /100 | #60 | Exceptional 96.9% |
| Creek | 99.8 /100 | #61 | Exceptional 96.9% |
| Immigrants | North America | 99.8 /100 | #62 | Exceptional 96.9% |
| Immigrants | Northern Europe | 99.7 /100 | #63 | Exceptional 96.9% |
| Immigrants | Austria | 99.7 /100 | #64 | Exceptional 96.9% |
| Canadians | 99.7 /100 | #65 | Exceptional 96.9% |
| Ukrainians | 99.7 /100 | #66 | Exceptional 96.9% |
| Native Hawaiians | 99.7 /100 | #67 | Exceptional 96.9% |
| Immigrants | India | 99.6 /100 | #68 | Exceptional 96.9% |
| Iranians | 99.6 /100 | #69 | Exceptional 96.8% |